

百度了一下时下流行的监控框架,选择了prometheus集成到我们系统中,下面记录下具体部署和集成步骤
使用docker-compose 部署 prometheus 和grafana (图标展示指标)
docker-compose.yml
version: "3.6"
services:
 prom:
  image: prom/prometheus
  command: --web.enable-lifecycle --config.file=/etc/prometheus/prometheus.yml
  restart: always
  ports:
    - '9091:9090'
  volumes:
   - './config:/etc/prometheus'
 grafana:
  image: grafana/grafana
  ports:
    - 3000:3000
prometheus.yml
# my global config
global:
  scrape_interval: 15s # Set the scrape interval to every 15 seconds. Default is every 1 minute.
  evaluation_interval: 15s # Evaluate rules every 15 seconds. The default is every 1 minute.
  # scrape_timeout is set to the global default (10s).

# Alertmanager configuration
alerting:
  alertmanagers:
    - static_configs:
        - targets:
          # - alertmanager:9093

# Load rules once and periodically evaluate them according to the global 'evaluation_interval'.
rule_files:
  # - "first_rules.yml"
  # - "second_rules.yml"

# A scrape configuration containing exactly one endpoint to scrape:
# Here it's Prometheus itself.
scrape_configs:
  # The job name is added as a label `job=<job_name>` to any timeseries scraped from this config.
  - job_name: "prometheus"

    # metrics_path defaults to '/metrics'
    # scheme defaults to 'http'.

    static_configs:
      - targets: ["172.21.183.3:9091"]
  - job_name: "jsaas_web"
    #scheme: 'https'
    #tls_config:
    #  insecure_skip_verify: true
    metrics_path: '/uc/actuator/prometheus'
    static_configs:
      - targets: ["172.18.8.199:8080"]
--web.enable-lifecycle 次参数是开启api 刷新prometheus.yml配置文件
curl -XPOST http://localhost:9091/-/reload
-----------------springboot配置-----------------------
在springboot 的pom.xml中引入依赖
        <dependency>
            <groupId>io.micrometer</groupId>
            <artifactId>micrometer-registry-prometheus</artifactId>
            <version>1.7.3</version>
        </dependency>
                <dependency>
            <groupId>org.springframework.boot</groupId>
            <artifactId>spring-boot-starter-actuator</artifactId>
        </dependency>
注:prometheus 官方提供的spring-boot 客户端不支持springboot2.0 这里使用micrometer
在bootstrap.yaml或application.yaml 中添加相关配置
management:
  endpoints:
    web:
      exposure:
        include: '*' #暴露全部actuator的接口
  metrics:
    tags:
      application: ${spring.application.name} #prometheus服务器对服务打标签,这里配置应用名字
启动服务web服务,此时访问 http://ip:port/actuator/prometheus ,返回响应的metric
这个时候就可以访问监控服务了 http://ip:9091
可以在graph 里面查询actuator/prometheus 返回的各项指标值
我们想把这下数字指标转化为图形报表,我们可以借助grafana ,
我们访问 http://:3000 默认账号密码是admin/admin
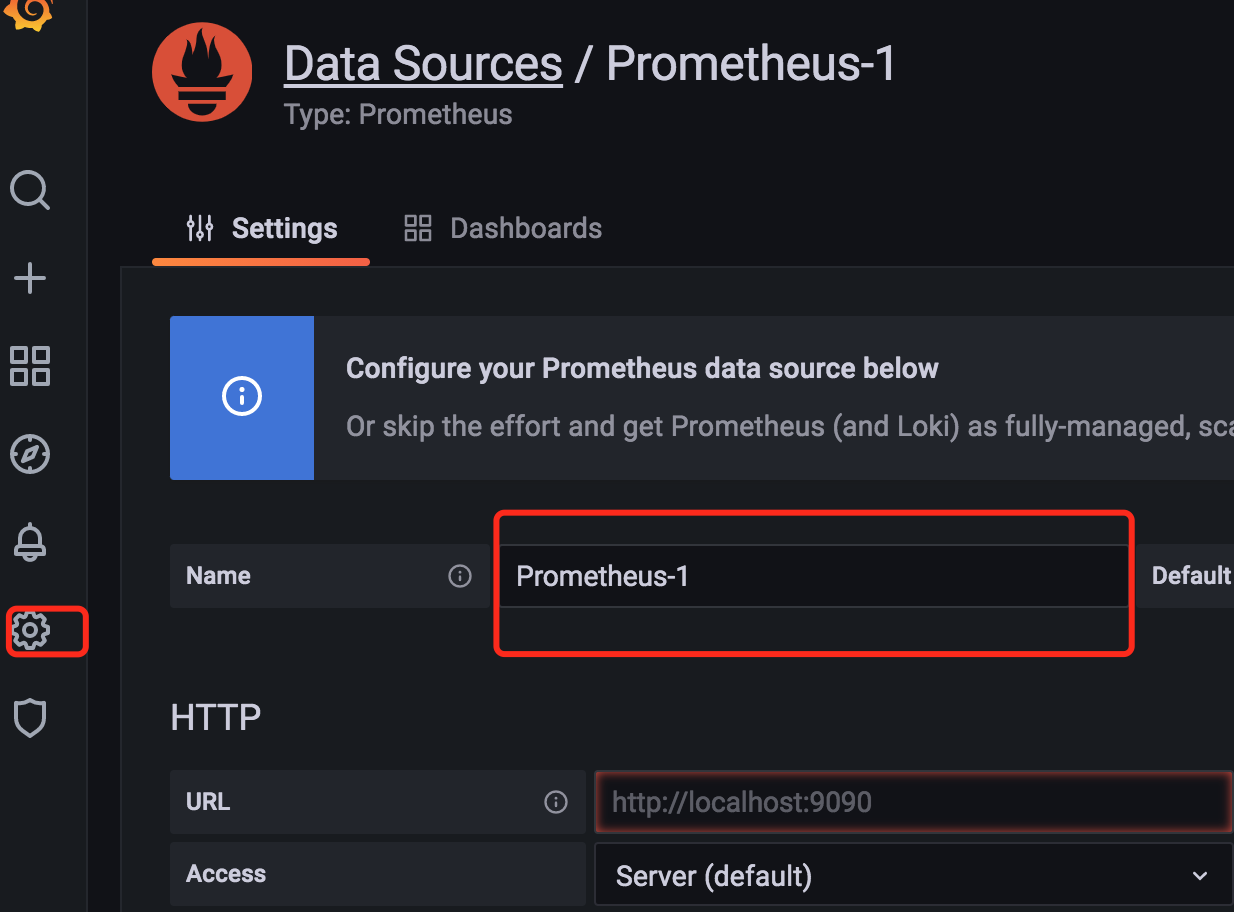
下面就可以导入或者新建dashboard 了,再dashboard 里面可以新建alert 报警
mysql 索引
