pyspark编程实践(replace&fill&otherwise&pivot&window)
fill关键字的用法
-
Replace null values, alias for
na.fill().DataFrame.fillna()andDataFrameNaFunctions.fill()are aliases of each other.-
Parameters
value – int, long, float, string, bool or dict. Value to replace null values with. If the value is a dict, then subset is ignored and value must be a mapping from column name (string) to replacement value. The replacement value must be an int, long, float, boolean, or string.subset – optional list of column names to consider. Columns specified in subset that do not have matching data type are ignored. For example, if value is a string, and subset contains a non-string column, then the non-string column is simply ignored.
-
df4.na.fill(50).show()
OUT:
+---+------+-----+
|age|height| name|
+---+------+-----+
| 10|    80|Alice|
|  5|    50|  Bob|
| 50|    50|  Tom|
| 50|    50| null|
+---+------+-----+
replace关键字(与pandas中的replace意义一样)
- Parameters
- to_replace – bool, int, long, float, string, list or dict. Value to be replaced. If the value is a dict, then value is ignored or can be omitted, and to_replace must be a mapping between a value and a replacement.
- value – bool, int, long, float, string, list or None. The replacement value must be a bool, int, long, float, string or None. If value is a list, value should be of the same length and type as to_replace. If value is a scalar and to_replace is a sequence, then value is used as a replacement for each item in to_replace.
- subset – optional list of column names to consider. Columns specified in subset that do not have matching data type are ignored. For example, if value is a string, and subset contains a non-string column, then the non-string column is simply ignored.
df4.na.replace(10, 20).show()
OUT:
+----+------+-----+
| age|height| name|
+----+------+-----+
|  20|    80|Alice|
|   5|  null|  Bob|
|null|  null|  Tom|
|null|  null| null|
+----+------+-----+

df4.na.replace({'Alice': None}).show()
OUT:
+----+------+----+
| age|height|name|
+----+------+----+
|  10|    80|null|
|   5|  null| Bob|
|null|  null| Tom|
|null|  null|null|
+----+------+----+

df4.na.replace(['Alice', 'Bob'], ['A', 'B'], 'name').show()
OUT:
+----+------+----+
| age|height|name|
+----+------+----+
|  10|    80|   A|
|   5|  null|   B|
|null|  null| Tom|
|null|  null|null|
+----+------+----+
otherwise*可以在select数据的时候和F.when进行搭配使用, 从而同时对数据进行选择性处理
# when搭配otherwise得到新数据
df.select('smoker', F.when(df.tip>3, 999).otherwise(-999)).show(3)
OUT:
+---+------------------------------------------+
|day|CASE WHEN (tip > 3) THEN 999 ELSE -999 END|
+---+------------------------------------------+
|Sun|                                      -999|
|Sun|                                      -999|
|Sun|                                       999|
+---+------------------------------------------+
only showing top 3 rows

# when搭配otherwise生成新列, 可以直接替代if xxx else xxx的操作
df_tip.withColumn('a', F.when(df_tip.tip>3, 999).otherwise(888)).show(3)
OUT:
+----------+----+------+---+------+----+------+----+
|total_bill| tip|smoker|day|  time|size| tip_2|   a|
+----------+----+------+---+------+----+------+----+
|     16.99|1.01|    No|Sun|Dinner| 2.0|1.0201|-888|
|     10.34|1.66|    No|Sun|Dinner| 3.0|2.7556|-888|
|     21.01| 3.5|    No|Sun|Dinner| 3.0| 12.25| 999|
+----------+----+------+---+------+----+------+----+
only showing top 3 rows
pivot用法
df = spark.createDataFrame([('0001','F','H',1), ('0002','M','M',0), ('0003','F','L',1),('0004','F','H',0), ('0005','M','M',1), ('0006','F','H',1)],['userid','gender','level','vip'])
df.show()
OUT:
+------+------+-----+---+
|userid|gender|level|vip|
+------+------+-----+---+
|  0001|     F|    H|  1|
|  0002|     M|    M|  0|
|  0003|     F|    L|  1|
|  0004|     F|    H|  0|
|  0005|     M|    M|  1|
|  0006|     F|    H|  1|
+------+------+-----+---+

df.groupBy('gender')\
                .pivot('level', ['H','M','L'])\
                .agg(F.countDistinct('userid'))\
                .fillna(0).show()
OUT:
+------+---+---+---+
|gender|  H|  M|  L|
+------+---+---+---+
|     F|  3|  0|  1|
|     M|  0|  2|  0|
+------+---+---+---+
Window(over)关键字的用法
window关键字可以算是是spark中一个非常好用且关键的功能,不过其看起来也是稍显复杂的
from pyspark.sql import Window
from pyspark.sql.types import *
from pyspark.sql.functions import *
empsalary_data = [
("sales", 1, "Alice", 5000, ["game", "ski"]),
("personnel", 2, "Olivia", 3900, ["game", "ski"]),
("sales", 3, "Ella", 4800, ["skate", "ski"]),
("sales", 4, "Ebba", 4800, ["game", "ski"]),
("personnel", 5, "Lilly", 3500, ["climb", "ski"]),
("develop", 7, "Astrid", 4200, ["game", "ski"]),
("develop", 8, "Saga", 6000, ["kajak", "ski"]),
("develop", 9, "Freja", 4500, ["game", "kajak"]),
("develop", 10, "Wilma", 5200, ["game", "ski"]),
("develop", 11, "Maja", 5200, ["game", "farming"])]
empsalary=spark.createDataFrame(empsalary_data,
schema=["depName", "empNo", "name", "salary", "hobby"])
empsalary.show()
+---------+-----+------+------+---------------+
| depName|empNo| name|salary| hobby|
+---------+-----+------+------+---------------+
| sales| 1| Alice| 5000| [game, ski]|
|personnel| 2|Olivia| 3900| [game, ski]|
| sales| 3| Ella| 4800| [skate, ski]|
| sales| 4| Ebba| 4800| [game, ski]|
|personnel| 5| Lilly| 3500| [climb, ski]|
| develop| 7|Astrid| 4200| [game, ski]|
| develop| 8| Saga| 6000| [kajak, ski]|
| develop| 9| Freja| 4500| [game, kajak]|
| develop| 10| Wilma| 5200| [game, ski]|
| develop| 11| Maja| 5200|[game, farming]|
+---------+-----+------+------+---------------+
# ==========================运用partitionBy关键字去分组DataFrame=========================
overCategory = Window.partitionBy("depName")
df = empsalary.withColumn(
"salaries", collect_list("salary").over(overCategory)).withColumn(
"average_salary",(avg("salary").over(overCategory)).cast("int")).withColumn(
"total_salary",sum("salary").over(overCategory)).select(
"depName","empNo","name","salary","salaries","average_salary","total_salary")
df.show(20,False)
+---------+-----+------+------+------------------------------+--------------+------------+
|depName |empNo|name |salary|salaries |average_salary|total_salary|
+---------+-----+------+------+------------------------------+--------------+------------+
|develop |7 |Astrid|4200 |[4200, 6000, 4500, 5200, 5200]|5020 |25100 |
|develop |8 |Saga |6000 |[4200, 6000, 4500, 5200, 5200]|5020 |25100 |
|develop |9 |Freja |4500 |[4200, 6000, 4500, 5200, 5200]|5020 |25100 |
|develop |10 |Wilma |5200 |[4200, 6000, 4500, 5200, 5200]|5020 |25100 |
|develop |11 |Maja |5200 |[4200, 6000, 4500, 5200, 5200]|5020 |25100 |
|sales |1 |Alice |5000 |[5000, 4800, 4800] |4866 |14600 |
|sales |3 |Ella |4800 |[5000, 4800, 4800] |4866 |14600 |
|sales |4 |Ebba |4800 |[5000, 4800, 4800] |4866 |14600 |
|personnel|2 |Olivia|3900 |[3900, 3500] |3700 |7400 |
|personnel|5 |Lilly |3500 |[3900, 3500] |3700 |7400 |
+---------+-----+------+------+------------------------------+--------------+------------+
# ========================partition后用到了orderBy方法===============
# 可以看到一模一样的运算语句给出了完全不一样的结果, 因为每次的partition的结果都是按照
# salary进行了一个预排序工作,这样会导致在collect_list的时候也会存在一个从后往前收集的一个效果
'''
an Ordered Frame has the following traits
+ 被一个或者是多个columns生成
+ Followed by orderby on a column
+ Each row have a corresponding frame
+ The frame will not be the same for every row within the same partition.By default,the frame contains all previous rows and the currentRow
+ Aggregate/Window functions can be applied to each row+frame to generate a value
'''
overCategory = Window.partitionBy("depName").orderBy(desc("salary"))
df = empsalary.withColumn(
"salaries",collect_list("salary").over(overCategory)).withColumn(
"average_salary",(avg("salary").over(overCategory)).cast("int")).withColumn(
"total_salary",sum("salary").over(overCategory)).select(
"depName","empNo","name","salary","salaries","average_salary","total_salary")
df.show(20,False)
+---------+-----+------+------+------------------------------+--------------+------------+
|depName |empNo|name |salary|salaries |average_salary|total_salary|
+---------+-----+------+------+------------------------------+--------------+------------+
|develop |8 |Saga |6000 |[6000] |6000 |6000 |
|develop |10 |Wilma |5200 |[6000, 5200, 5200] |5466 |16400 |
|develop |11 |Maja |5200 |[6000, 5200, 5200] |5466 |16400 |
|develop |9 |Freja |4500 |[6000, 5200, 5200, 4500] |5225 |20900 |
|develop |7 |Astrid|4200 |[6000, 5200, 5200, 4500, 4200]|5020 |25100 |
|sales |1 |Alice |5000 |[5000] |5000 |5000 |
|sales |3 |Ella |4800 |[5000, 4800, 4800] |4866 |14600 |
|sales |4 |Ebba |4800 |[5000, 4800, 4800] |4866 |14600 |
|personnel|2 |Olivia|3900 |[3900] |3900 |3900 |
|personnel|5 |Lilly |3500 |[3900, 3500] |3700 |7400 |
+---------+-----+------+------+------------------------------+--------------+------------+
# ======在window模型下进行数据切分后可以运用rank排序类型的函数进行复杂的操作==============
overCategory = Window.partitionBy("depName").orderBy(desc("salary"))
df = empsalary.withColumn(
"salaries",collect_list("salary").over(overCategory)).withColumn(
"rank",rank().over(overCategory)).withColumn(
"dense_rank",dense_rank().over(overCategory)).withColumn(
"row_number",row_number().over(overCategory)).withColumn(
"ntile",ntile(3).over(overCategory)).withColumn(
"percent_rank",percent_rank().over(overCategory)).select(
"depName","empNo","name","salary","rank","dense_rank","row_number","ntile","percent_rank")
df.show(20,False)
+---------+-----+------+------+----+----------+----------+-----+------------+
|depName |empNo|name |salary|rank|dense_rank|row_number|ntile|percent_rank|
+---------+-----+------+------+----+----------+----------+-----+------------+
|develop |8 |Saga |6000 |1 |1 |1 |1 |0.0 |
|develop |10 |Wilma |5200 |2 |2 |2 |1 |0.25 |
|develop |11 |Maja |5200 |2 |2 |3 |2 |0.25 |
|develop |9 |Freja |4500 |4 |3 |4 |2 |0.75 |
|develop |7 |Astrid|4200 |5 |4 |5 |3 |1.0 |
|sales |1 |Alice |5000 |1 |1 |1 |1 |0.0 |
|sales |3 |Ella |4800 |2 |2 |2 |2 |0.5 |
|sales |4 |Ebba |4800 |2 |2 |3 |3 |0.5 |
|personnel|2 |Olivia|3900 |1 |1 |1 |1 |0.0 |
|personnel|5 |Lilly |3500 |2 |2 |2 |2 |1.0 |
+---------+-----+------+------+----+----------+----------+-----+------------+
# ====================利用rank函数,我们能快速的得到类似于top2之类的数据===========
overCategory = Window.partitionBy("depName").orderBy(desc("salary"))
df = empsalary.withColumn(
"row_number",row_number().over(overCategory)).filter(
"row_number <= 2").select(
"depName","empNo","name","salary")
df.show(20,False)
+---------+-----+------+------+
|depName |empNo|name |salary|
+---------+-----+------+------+
|develop |8 |Saga |6000 |
|develop |10 |Wilma |5200 |
|sales |1 |Alice |5000 |
|sales |3 |Ella |4800 |
|personnel|2 |Olivia|3900 |
|personnel|5 |Lilly |3500 |
+---------+-----+------+------+
# ===================运用lag与lead,拿到前一个或者后一个数据==================
overCategory = Window.partitionBy("depname").orderBy(desc("salary"))
df = empsalary.withColumn(
"lead",lead("salary",1).over(overCategory)).withColumn(
"lag",lag("salary",1).over(overCategory)).select(
"depName","empNo","name","salary","lead","lag")
df.show(20,False)
+---------+-----+------+------+----+----+
|depName |empNo|name |salary|lead|lag |
+---------+-----+------+------+----+----+
|develop |8 |Saga |6000 |5200|null|
|develop |10 |Wilma |5200 |5200|6000|
|develop |11 |Maja |5200 |4500|5200|
|develop |9 |Freja |4500 |4200|5200|
|develop |7 |Astrid|4200 |null|4500|
|sales |1 |Alice |5000 |4800|null|
|sales |3 |Ella |4800 |4800|5000|
|sales |4 |Ebba |4800 |null|4800|
|personnel|2 |Olivia|3900 |3500|null|
|personnel|5 |Lilly |3500 |null|3900|
+---------+-----+------+------+----+----+
# 接下来就可以做出错位相减的操作
diff = df.withColumn(
"highter_than_next",col("salary") - col("lead")).withColumn(
"lower_than_previous",col("lag") - col("salary"))
diff.show()
+---------+-----+------+------+----+----+-----------------+-------------------+
| depName|empNo| name|salary|lead| lag|highter_than_next|lower_than_previous|
+---------+-----+------+------+----+----+-----------------+-------------------+
| develop| 8| Saga| 6000|5200|null| 800| null|
| develop| 10| Wilma| 5200|5200|6000| 0| 800|
| develop| 11| Maja| 5200|4500|5200| 700| 0|
| develop| 9| Freja| 4500|4200|5200| 300| 700|
| develop| 7|Astrid| 4200|null|4500| null| 300|
| sales| 1| Alice| 5000|4800|null| 200| null|
| sales| 3| Ella| 4800|4800|5000| 0| 200|
| sales| 4| Ebba| 4800|null|4800| null| 0|
|personnel| 2|Olivia| 3900|3500|null| 400| null|
|personnel| 5| Lilly| 3500|null|3900| null| 400|
+---------+-----+------+------+----+----+-----------------+-------------------+
# 缺失填充
diff = df.withColumn(
"highter_than_next",when(col("lead").isNull(),0).otherwise(col("lead"))).withColumn(
"lower_than_previous",when(col("lag").isNull(),0).otherwise(col("lag")))
diff.show()
+---------+-----+------+------+----+----+-----------------+-------------------+
| depName|empNo| name|salary|lead| lag|highter_than_next|lower_than_previous|
+---------+-----+------+------+----+----+-----------------+-------------------+
| develop| 8| Saga| 6000|5200|null| 5200| 0|
| develop| 10| Wilma| 5200|5200|6000| 5200| 6000|
| develop| 11| Maja| 5200|4500|5200| 4500| 5200|
| develop| 9| Freja| 4500|4200|5200| 4200| 5200|
| develop| 7|Astrid| 4200|null|4500| 0| 4500|
| sales| 1| Alice| 5000|4800|null| 4800| 0|
| sales| 3| Ella| 4800|4800|5000| 4800| 5000|
| sales| 4| Ebba| 4800|null|4800| 0| 4800|
|personnel| 2|Olivia| 3900|3500|null| 3500| 0|
|personnel| 5| Lilly| 3500|null|3900| 0| 3900|
+---------+-----+------+------+----+----+-----------------+-------------------+
diff.filter(col("highter_than_next") > (lit(0.5)*col("salary"))).show(3)
+-------+-----+-----+------+----+----+-----------------+-------------------+
|depName|empNo| name|salary|lead| lag|highter_than_next|lower_than_previous|
+-------+-----+-----+------+----+----+-----------------+-------------------+
|develop| 8| Saga| 6000|5200|null| 5200| 0|
|develop| 10|Wilma| 5200|5200|6000| 5200| 6000|
|develop| 11| Maja| 5200|4500|5200| 4500| 5200|
+-------+-----+-----+------+----+----+-----------------+-------------------+
only showing top 3 rows
# ===========在spark中实现类似pandas的cumsum的累计计算===========
overCategory = Window.partitionBy("depname").orderBy(desc("salary"))
running_total = empsalary.withColumn(
"rank",rank().over(overCategory)).withColumn(
"costs",sum("salary").over(overCategory)).select(
"depName","empNo","name","salary","rank","costs")
running_total.show(20,False)
+---------+-----+------+------+----+-----+
|depName |empNo|name |salary|rank|costs|
+---------+-----+------+------+----+-----+
|develop |8 |Saga |6000 |1 |6000 |
|develop |10 |Wilma |5200 |2 |16400|
|develop |11 |Maja |5200 |2 |16400|
|develop |9 |Freja |4500 |4 |20900|
|develop |7 |Astrid|4200 |5 |25100|
|sales |1 |Alice |5000 |1 |5000 |
|sales |3 |Ella |4800 |2 |14600|
|sales |4 |Ebba |4800 |2 |14600|
|personnel|2 |Olivia|3900 |1 |3900 |
|personnel|5 |Lilly |3500 |2 |7400 |
+---------+-----+------+------+----+-----+
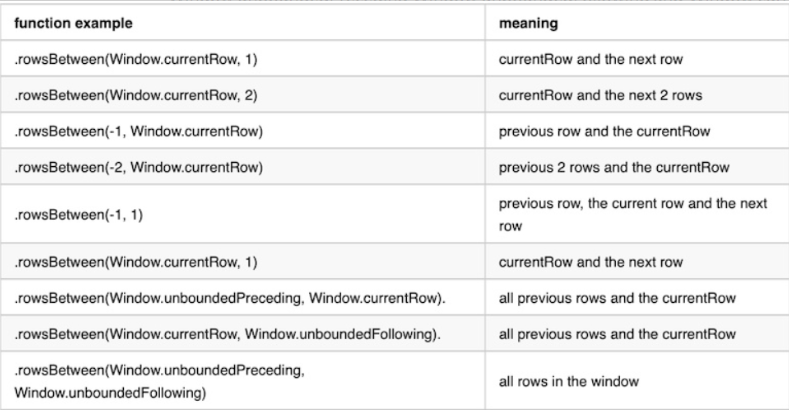
# =======Range Frame(自定义区间)================
# ============区间说明见下表================
overCategory = Window.partitionBy("depName").rowsBetween(
Window.currentRow,1)
df = empsalary.withColumn(
"salaries",collect_list("salary").over(overCategory)).withColumn(
"total_salary",sum("salary").over(overCategory))
df = df.select("depName","empNo","name","salary","salaries","total_salary")
df.show(20,False)
+---------+-----+------+------+------------+------------+
|depName |empNo|name |salary|salaries |total_salary|
+---------+-----+------+------+------------+------------+
|develop |7 |Astrid|4200 |[4200, 6000]|10200 |
|develop |8 |Saga |6000 |[6000, 4500]|10500 |
|develop |9 |Freja |4500 |[4500, 5200]|9700 |
|develop |10 |Wilma |5200 |[5200, 5200]|10400 |
|develop |11 |Maja |5200 |[5200] |5200 |
|sales |1 |Alice |5000 |[5000, 4800]|9800 |
|sales |3 |Ella |4800 |[4800, 4800]|9600 |
|sales |4 |Ebba |4800 |[4800] |4800 |
|personnel|2 |Olivia|3900 |[3900, 3500]|7400 |
|personnel|5 |Lilly |3500 |[3500] |3500 |
+---------+-----+------+------+------------+------------+
# ==============取到中位数====================
@udf("long")
def median_udf(s):
index = int(len(s) / 2)
return s[index]
overCategory = Window.partitionBy("depName").orderBy("salary").rowsBetween(
Window.unboundedPreceding,Window.unboundedFollowing)
df = empsalary.withColumn("salaries",collect_list("salary").over(overCategory)).withColumn("median_salary",median_udf(col("salaries")))
df = df.select("depName","empNo","name","salary","salaries","median_salary")
df.show(20,False)

 浙公网安备 33010602011771号