ELK+Redis 解析Nginx日志
一、ELK简介
Elk是指logstash,elasticsearch,kibana三件套,我们一般使用它们做日志分析。
ELK工作原理图:
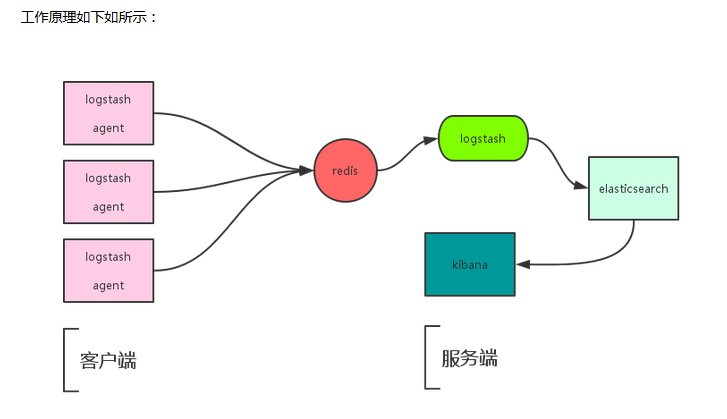
简单来讲ELK具体的工作流程就是客户端的logstash agent(shipper)从日志里取出数据推送到服务端的redis里,服务端的logstash从redis里取出数据推送到elasticsearch并产生索引,然后使用Kibana进行页面展示。
二.ELK准备环境配置
1.搭建环境(都是在Centos6.8系统下操作完成):
Ip地址 节点 部署服务
192.168.100.10 ELK-node1 elasticsearch + logstrsh
192.168.100.20 ELK-node2 elasticsearch + redis + kibana
192.168.100.30 nginx-agent nginx + logstash
2.软件下载地址及版本:
cd /usr/local/src/
wget https://download.elasticsearch.org/elasticsearch/release/org/elasticsearch/distribution/tar/elasticsearch/2.3.0/elasticsearch-2.3.0.tar.gz
wget https://download.elastic.co/logstash/logstash/logstash-1.5.4.tar.gz
curl -L -O https://download.elastic.co/kibana/kibana/kibana-4.5.1-linux-x64.tar.gz
wget http://download.redis.io/releases/redis-3.0.7.tar.gz
3.各服务器安装jdk,jdk要1.7以上的版本.
rpm -ivh jre-8u91-linux-x64.rpm
node1 node2 节点部署elasticsearch + logstrsh.
1.安装elasticsearch
cd /usr/local/src/
wget https://download.elasticsearch.org/elasticsearch/release/org/elasticsearch/distribution/tar/elasticsearch/2.3.0/elasticsearch-2.3.0.tar.gz

tar -zxvf elasticsearch-2.3.0.tar.gz -C /usr/local/
ln -s elasticsearch-2.3.0 elasticsearch
mkdir -pv /usr/local/elasticsearch/data
mkdir -pv /usr/local/elasticsearch/logs		//日志文件目录

#主节点配置如下:
grep '^[a-z]' elasticsearch.yml
cluster.name: ELK-elasticsearch
node.name: node-1
path.data: /usr/local/elasticsearch/data
path.logs: /usr/local/elasticsearch/logs
bootstrap.mlockall: true
network.host: 192.168.100.10
http.port: 9200
node.master: true
node.data: true

#集群节点参数详解:
https://my.oschina.net/liuxundemo/blog/688736?p={{page}}

启动elasticsearch:
elasticsearch只能以普通用户运行

创建elasticsearch运行用户,es只能用普通用户启动.
groupadd elasticsearch
useradd -g elasticsearch  elasticsearch
chown -R elasticsearch:elasticsearch /usr/local/elasticsearch
/usr/local/elasticsearch/bin/elasticsearch  >/dev/null 2>&1 &

服务管理的插件:
elasticsearch的插件应用
http://www.cnblogs.com/xing901022/p/5962722.html

安装集群管理插件:
/usr/local/elasticsearch/bin/plugin install mobz/elasticsearch-head
http://192.168.100.10:9200/_plugin/head/

health状况:

curl '192.168.100.10:9200/_cat/health?v'
epoch      timestamp cluster       status node.total node.data shards pri relo init unassign pending_tasks max_task_wait_time active_shards_percent
1488389751 01:35:51  elasticsearch green           1         1      0   0    0    0        0             0                  -                100.0%

curl -X GET http://192.168.100.10:9200     //获取网页内容
curl -I GET http://192.168.100.10:9200  //获取网页头部信息,200正常
从节点192.168.100.20 node2 elasticsearch配置如下:
#从节点配置如下:
cluster.name: ELK-elasticsearch
node.name: node-2
path.data: /usr/local/elasticsearch/data
path.logs: /usr/local/elasticsearch/logs
bootstrap.mlockall: true
network.host: 192.168.100.20
http.port: 9200
discovery.zen.ping.unicast.hosts: ["192.168.100.10:9300"]
LogStash部署和使用(主节点和从节点一样,只要服务启动正常即可):
cd /usr/local/src/
wget https://download.elastic.co/logstash/logstash/logstash-1.5.4.tar.gz
[root@localhost local]# tar -zxvf logstash-1.5.4.tar.gz -C /usr/local/
[root@localhost local]#ln -s logstash-1.5.4 logstash
标准输入输出:
/usr/local/logstash/bin/logstash -e 'input { stdin{} } output { stdout{}}'
#加东西可以改变输出:
[root@localhost ~]# /usr/local/logstash/bin/logstash -e 'input { stdin{} } output { stdout{codec => rubydebug}}'
#标准输出到elasticsearch中,定义host和协议
/usr/local/logstash/bin/logstash -e 'input { stdin{} } output { elasticsearch { host => "192.168.100.10" protocol => "http"}}'
#多重输出
/usr/local/logstash/bin/logstash -e 'input { stdin{} } output { elasticsearch { host => "192.168.100.10" protocol => "http"} stdout{ codec => rubydebug }}'
启动logstrash
/usr/local/logstash/bin/logstash -f /usr/local/logstash/config/logstrash.conf
#logstash解析nginx时间字段
http://blog.csdn.net/jianblog/article/details/54585043

logstash配置文件编写:
#文件输入到文件输出.
logstash.conf
input {
  file{
      path => "/var/log/messages"
  }
}
output {
  file {
    path => "/tmp/%{+YYYY-MM-dd}.messages.gz"
    gzip => true
  }
}
#文件输入到文件和es中
input {

  file{
      path => "/var/log/messages"
  }
}
output {

  file {
    path => "/tmp/%{+YYYY-MM-dd}.messages.gz"
    gzip => true
  }
  elasticsearch {
    host => "192.168.100.10"
    protocol => "http"
    index => "sysem-messages-%{+YYYY.MM.dd}"
  }

}
启动logstrash
/usr/local/logstash/bin/logstash -f /usr/local/logstash/config/logstrash.conf
安装redis保证服务启动正常即可:
wget http://download.redis.io/releases/redis-3.0.7.tar.gz
tar -zxvf redis-3.0.7
make && make install

[root@localhost ~]#nohup redis-server 2>&1 &
[root@localhost ~]# redis-cli -h 192.168.100.20 -p 6379
192.168.21.128:6379> select 1
OK
192.168.100.20:6379[1]> keys *
1) "sys-messages"
192.168.100.20:6379[1]> LLEN sys-messages  #查看redis 列表的长度
(integer) 42120
192.168.100.20:6379[1]> LINDEX sys-messages -1  #查看列表最后的一行
"{\"message\":\"hello logstrash to redis sucess\",\"@version\":\"1\",\"@timestamp\":\"2017-02-19T02:35:44.082Z\",\"host\":\"localhost.localdomain\",\"path\":\"/var/log/messages\"}"
192.168.100.20:6379[1]>
安装kibana:
安装kibana
curl -L -O https://download.elastic.co/kibana/kibana/kibana-4.5.1-linux-x64.tar.gz
tar -zxvf kibana-4.5.1-linux-x64.tar.gz -C /usr/local
ln -s kibana-4.5.1-linux-x64 kibana
vim kibana.yml
elasticsearch_url: "http://192.168.100.10:9200"    #es主节点的ip地址
启动kibana服务
/usr/local/kibana/bin/kibana &
访问地址:
http://192.168.100.20:5601/app/kibana
在192.168.100.30 上安装nginx和logstash作为nginx日志输出端.
ELK收集Nginx日志有两种方式:
1.使用codec的json插件将日志的域进行分段,使用key-value的方式,使日志格式更清晰,易于搜索,还可以降低cpu的负载 ,更改nginx的配置文件的日志格式,使用json
2.不用修改Nginx的日志格式,通过filter过滤器来改变日志的格式.
我们这里先讲第一种方式:Nginx日志改成json输出。
logstash_nginx端的日志格式如下:
[root@logstash_nginx ~]#sed -n '15,33p' /etc/nginx/nginx.conf

log_format logstash_json '{ "@timestamp": "$time_local", '
                         '"@fields": { '
                         '"remote_addr": "$remote_addr", '
                         '"remote_user": "$remote_user", '
                         '"body_bytes_sent": "$body_bytes_sent", '
                         '"request_time": "$request_time", '
                         '"status": "$status", '
                         '"request": "$request", '
                         '"request_method": "$request_method", '
                         '"http_referrer": "$http_referer", '
                         '"body_bytes_sent":"$body_bytes_sent", '
			 '"http_user_agent": "$http_user_agent" , '
 			 '"http_x_forwarded_for": "$http_x_forwarded_for"} }';


    access_log  /var/log/nginx/access.log  logstash_json;
启动nginx
[root@logstash_nginx ~]# /usr/sbin/nginx -t
nginx: the configuration file /etc/nginx/nginx.conf syntax is ok
nginx: configuration file /etc/nginx/nginx.conf test is successful

[root@logstash_nginx ~]# /usr/sbin/nginx
logstash配置如下:
#使用logstash收集nginx的访问日志
#vim /usr/local/logstash/logstash-agent.conf
input {
  file {
    type => "nginx-access-log"
    path => "/var/log/nginx/access.log"
    codec => "json"
  }
}

filter {

}
output {
  redis {
    data_type => "list"
    key => "nginx-access-log"
    host => "192.168.100.20"
    port => "6379"
    db => "1"
 }

}

#logstash indexer端文件,从redis里面读取数据然后在es中

vim /usr/local/logstash/logstash_indexer.conf

input{
  redis{
    data_type => "list"
    key => "nginx-access-log"
    host => "redis-ip"
    port => "6379"
    db => "1"
  }
}

output {

  elasticsearch {
    host => "192.168.100.10"
    protocol => "http"
    index => "logstash-nginx-access-log-%{+YYYY.MM.dd}"
  }
}
确定没有问题后,重新启动logstash
/usr/local/logstash/bin/logstash -f /usr/local/logstash/bin/logstash-agent.conf
/usr/local/logstash/bin/logstash -f /usr/local/logstash/bin/logstash_indexer.conf
我们可以访问http://192.168.100.10:9200/_plugin/head/,如果配置无误可以看到nginx-access-log这个索引,说明logstash已经将日志发送到es端了.
然后在kibana里面创建你的索引即可.
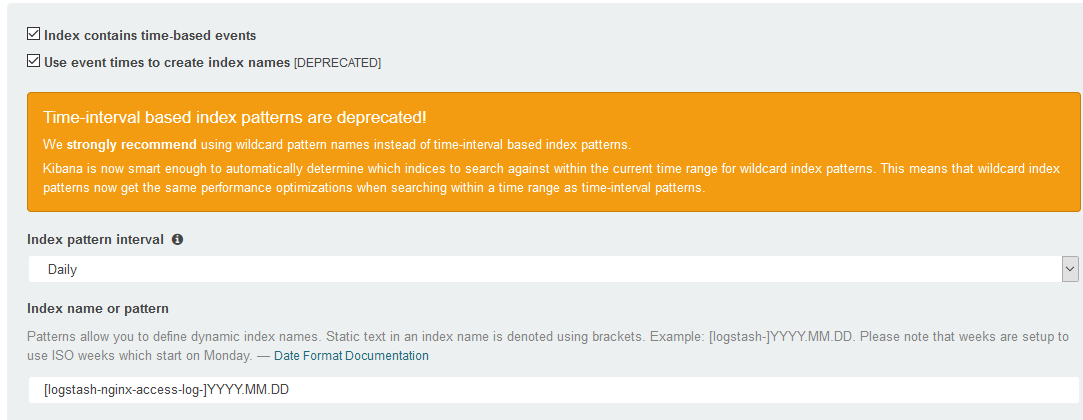
这样就可以收集到日志了。
elasticsearch的插件应用:
http://www.cnblogs.com/xing901022/p/5962722.html
使用Kibana 分析Nginx 日志并在 Dashboard上展示
http://www.cnblogs.com/hanyifeng/p/5860731.html
参考文档:
kibana画图参考文档:
http://blog.csdn.net/ming_311/article/details/50619859
http://www.cnblogs.com/hanyifeng/p/5857875.html
http://blog.oldboyedu.com/elk/
http://www.cnblogs.com/galengao/p/5780588.html
http://blog.csdn.net/wanglipo/article/details/50739820
http://www.jianshu.com/p/66e03eb6d95a
http://www.cnblogs.com/skyblue/p/5504595.html
Kibana反向代理配置:
1.Nginx安装(略):
2.Nginx配置 (kibana_proxy.conf)
#The default server

upstream kibana_proxy {
      server kibana-ip-address:5601;

        }

server {
   listen    80;
   server_name elk.xxx.com;

   location / {
      index index.html index.htm;
      auth_basic "welcome to kibana";
      auth_basic_user_file /etc/nginx/passwd.db;
      proxy_pass http://kibana_proxy;
    }
    location /status {
        stub_status on;
        access_log /var/log/nginx/kibana_status.log;
        auth_basic "NginxStatus";

 }

}

#生成认证登录的用户名和密码:

[root@elk-node conf.d]# htpasswd -c /etc/nginx/passwd.db admin
New password:
Re-type new password:
Adding password for user admin


# chmod 400 /etc/nginx/passwd.db      //修改网站认证数据库权限
# chown nginx. /etc/nginx/passwd.db   //修改网站认证数据库属主和属组
# cat /etc/nginx/passwd.db            //可以看到通过htpasswd生成的密码为加密格式
admin:8eZAz7BqcrXmY

 浙公网安备 33010602011771号