容器监控:cAdvisor
为了能够获取到Docker容器的运行状态,用户可以通过Docker的stats命令获取到当前主机上运行容器的统计信息,可以查看容器的CPU利用率、内存使用量、网络IO总量以及磁盘IO总量等信息。

除了使用命令以外,用户还可以通过Docker提供的HTTP API查看容器详细的监控统计信息。
CAdvisor是Google开源的一款用于展示和分析容器运行状态的可视化工具。通过在主机上运行CAdvisor用户可以轻松的获取到当前主机上容器的运行统计信息,并以图表的形式向用户展示。
在本地运行CAdvisor也非常简单,直接运行一下命令即可:
docker run \
  --volume=/:/rootfs:ro \
  --volume=/var/run:/var/run:rw \
  --volume=/sys:/sys:ro \
  --volume=/var/lib/docker/:/var/lib/docker:ro \
  --publish=8080:8080 \
  --detach=true \
  --name=cadvisor \
  google/cadvisor:latest
但是因为主机的8080端口被占用了,所以把上面的命令修改成如下的:
docker run \
  --volume=/:/rootfs:ro \
  --volume=/var/run:/var/run:rw \
  --volume=/sys:/sys:ro \
  --volume=/var/lib/docker/:/var/lib/docker:ro \
  --publish=9095:9095 \
  --detach=true \
  --name=cadvisor \
  google/cadvisor:latest
但是启动后进行查看会有俩端口存在,一个时8080,另一个是9095.

通过如下步骤登陆到docker容器中查看命令的选项,会有一个-port参数,并且官网中也有明确的说明:
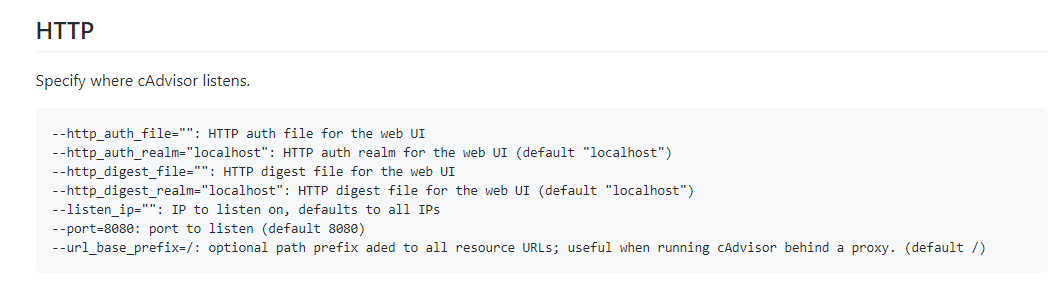
但是在使用的时候,却没法使用这个参数。
因此放弃使用docker方式部署,改用二进制的方式。
进入容器中查看命令选项
# docker exec -it cadvisor /bin/sh
/ # cd /usr/bin/
/usr/bin # ./cadvisor --help
Usage of ./cadvisor:
  -allow_dynamic_housekeeping
        Whether to allow the housekeeping interval to be dynamic (default true)
  -alsologtostderr
        log to standard error as well as files
  -application_metrics_count_limit int
        Max number of application metrics to store (per container) (default 100)
  -boot_id_file string
        Comma-separated list of files to check for boot-id. Use the first one that exists. (default "/proc/sys/kernel/random/boot_id")
  -bq_account string
        Service account email
  -bq_credentials_file string
        Credential Key file (pem)
  -bq_id string
        Client ID
  -bq_project_id string
        Bigquery project ID
  -bq_secret string
        Client Secret (default "notasecret")
  -collector_cert string
        Collector's certificate, exposed to endpoints for certificate based authentication.
  -collector_key string
        Key for the collector's certificate
  -container_hints string
        location of the container hints file (default "/etc/cadvisor/container_hints.json")
  -containerd string
        containerd endpoint (default "unix:///var/run/containerd.sock")
  -disable_metrics metrics
        comma-separated list of metrics to be disabled. Options are 'disk', 'network', 'tcp', 'udp', 'percpu', 'sched', 'process'. Note: tcp and udp are disabled by default due to high CPU usage. (default process,tcp,udp,sched)
  -docker string
        docker endpoint (default "unix:///var/run/docker.sock")
  -docker-tls
        use TLS to connect to docker
  -docker-tls-ca string
        path to trusted CA (default "ca.pem")
  -docker-tls-cert string
        path to client certificate (default "cert.pem")
  -docker-tls-key string
        path to private key (default "key.pem")
  -docker_env_metadata_whitelist string
        a comma-separated list of environment variable keys that needs to be collected for docker containers
  -docker_only
        Only report docker containers in addition to root stats
  -docker_root string
        DEPRECATED: docker root is read from docker info (this is a fallback, default: /var/lib/docker) (default "/var/lib/docker")
  -enable_load_reader
        Whether to enable cpu load reader
  -event_storage_age_limit string
        Max length of time for which to store events (per type). Value is a comma separated list of key values, where the keys are event types (e.g.: creation, oom) or "default" and the value is a duration. Default is applied to all non-specified event types (default "default=24h")
  -event_storage_event_limit string
        Max number of events to store (per type). Value is a comma separated list of key values, where the keys are event types (e.g.: creation, oom) or "default" and the value is an integer. Default is applied to all non-specified event types (default "default=100000")
  -global_housekeeping_interval duration
        Interval between global housekeepings (default 1m0s)
  -housekeeping_interval duration
        Interval between container housekeepings (default 1s)
  -http_auth_file string
        HTTP auth file for the web UI
  -http_auth_realm string
        HTTP auth realm for the web UI (default "localhost")
  -http_digest_file string
        HTTP digest file for the web UI
  -http_digest_realm string
        HTTP digest file for the web UI (default "localhost")
  -listen_ip string
        IP to listen on, defaults to all IPs
  -log_backtrace_at value
        when logging hits line file:N, emit a stack trace
  -log_cadvisor_usage
        Whether to log the usage of the cAdvisor container
  -log_dir string
        If non-empty, write log files in this directory
  -log_file string
        If non-empty, use this log file
  -logtostderr
        log to standard error instead of files
  -machine_id_file string
        Comma-separated list of files to check for machine-id. Use the first one that exists. (default "/etc/machine-id,/var/lib/dbus/machine-id")
  -max_housekeeping_interval duration
        Largest interval to allow between container housekeepings (default 1m0s)
  -max_procs int
        max number of CPUs that can be used simultaneously. Less than 1 for default (number of cores).
  -mesos_agent string
        Mesos agent address (default "127.0.0.1:5051")
  -mesos_agent_timeout duration
        Mesos agent timeout (default 10s)
  -port int
        port to listen (default 8080)
  -profiling
        Enable profiling via web interface host:port/debug/pprof/
  -prometheus_endpoint string
        Endpoint to expose Prometheus metrics on (default "/metrics")
  -skip_headers
        If true, avoid header prefixes in the log messages
  -stderrthreshold value
        logs at or above this threshold go to stderr (default 2)
  -storage_driver driver
        Storage driver to use. Data is always cached shortly in memory, this controls where data is pushed besides the local cache. Empty means none. Options are: <empty>, bigquery, elasticsearch, influxdb, kafka, redis, statsd, stdout
  -storage_driver_buffer_duration duration
        Writes in the storage driver will be buffered for this duration, and committed to the non memory backends as a single transaction (default 1m0s)
  -storage_driver_db string
        database name (default "cadvisor")
  -storage_driver_es_enable_sniffer
        ElasticSearch uses a sniffing process to find all nodes of your cluster by default, automatically
  -storage_driver_es_host string
        ElasticSearch host:port (default "http://localhost:9200")
  -storage_driver_es_index string
        ElasticSearch index name (default "cadvisor")
  -storage_driver_es_type string
        ElasticSearch type name (default "stats")
  -storage_driver_host string
        database host:port (default "localhost:8086")
  -storage_driver_influxdb_retention_policy string
        retention policy
  -storage_driver_kafka_broker_list string
        kafka broker(s) csv (default "localhost:9092")
  -storage_driver_kafka_ssl_ca string
        optional certificate authority file for TLS client authentication
  -storage_driver_kafka_ssl_cert string
        optional certificate file for TLS client authentication
  -storage_driver_kafka_ssl_key string
        optional key file for TLS client authentication
  -storage_driver_kafka_ssl_verify
        verify ssl certificate chain (default true)
  -storage_driver_kafka_topic string
        kafka topic (default "stats")
  -storage_driver_password string
        database password (default "root")
  -storage_driver_secure
        use secure connection with database
  -storage_driver_table string
        table name (default "stats")
  -storage_driver_user string
        database username (default "root")
  -storage_duration duration
        How long to keep data stored (Default: 2min). (default 2m0s)
  -store_container_labels
        convert container labels and environment variables into labels on prometheus metrics for each container. If flag set to false, then only metrics exported are container name, first alias, and image name (default true)
  -v value
        log level for V logs
  -version
        print cAdvisor version and exit
  -vmodule value
        comma-separated list of pattern=N settings for file-filtered logging
使用二进制方式部署
cd /home/cadvisor-0.37.0
wget https://github.com/google/cadvisor/releases/download/v0.37.0/cadvisor
# 普通本地运行:./cadvisor  -port=8080 &>>/var/log/cadvisor.log
使用service服务管理程序
# chown -R prometheus:prometheus /home/cadvisor-0.37.0
# chmod -R 777 /home/cadvisor-0.37.0   #防止因为selinux出现这个启动错误:Failed at step EXEC spawning /home/cadvisor-0.37.0/cadvisor: Permission denied

# vim /usr/lib/systemd/system/cadvisor.service
[Unit]
Description=cadvisor
Documentation=https://github.com/google/cadvisor/tree/master/docs
After=network.target

[Service]
Type=simple
User=prometheus
ExecStart=/home/cadvisor-0.37.0/cadvisor -port 9096
Restart=on-failure

[Install]
WantedBy=multi-user.target
通过访问http://localhost:9096可以查看,当前主机上容器的运行状态,如下所示:
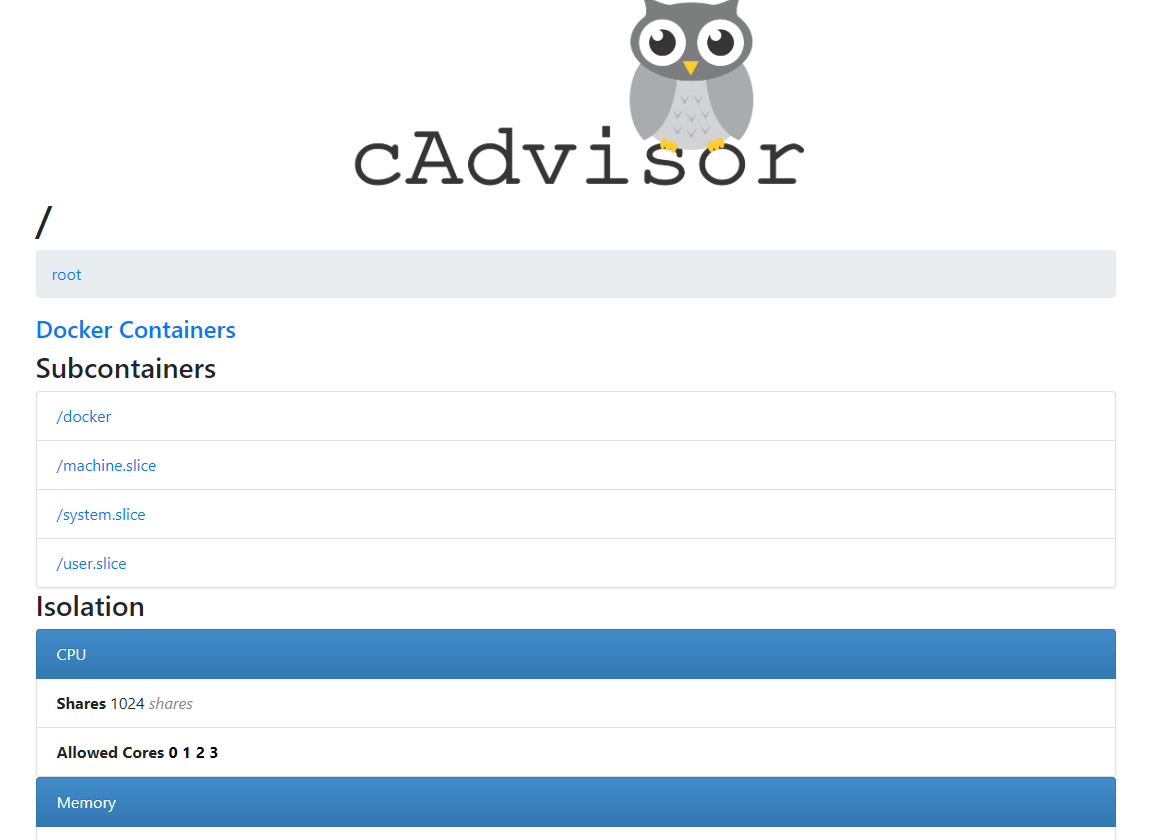
下面表格中列举了一些CAdvisor中获取到的典型监控指标:
| 指标名称 | 类型 | 含义 |
|---|---|---|
| container_cpu_load_average_10s | gauge | 过去10秒容器CPU的平均负载 |
| container_cpu_usage_seconds_total | counter | 容器在每个CPU内核上的累积占用时间 (单位:秒) |
| container_cpu_system_seconds_total | counter | System CPU累积占用时间(单位:秒) |
| container_cpu_user_seconds_total | counter | User CPU累积占用时间(单位:秒) |
| container_fs_usage_bytes | gauge | 容器中文件系统的使用量(单位:字节) |
| container_fs_limit_bytes | gauge | 容器可以使用的文件系统总量(单位:字节) |
| container_fs_reads_bytes_total | counter | 容器累积读取数据的总量(单位:字节) |
| container_fs_writes_bytes_total | counter | 容器累积写入数据的总量(单位:字节) |
| container_memory_max_usage_bytes | gauge | 容器的最大内存使用量(单位:字节) |
| container_memory_usage_bytes | gauge | 容器当前的内存使用量(单位:字节 |
| container_spec_memory_limit_bytes | gauge | 容器的内存使用量限制 |
| machine_memory_bytes | gauge | 当前主机的内存总量 |
| container_network_receive_bytes_total | counter | 容器网络累积接收数据总量(单位:字节) |
| container_network_transmit_bytes_total | counter | 容器网络累积传输数据总量(单位:字节) |
与Prometheus集成
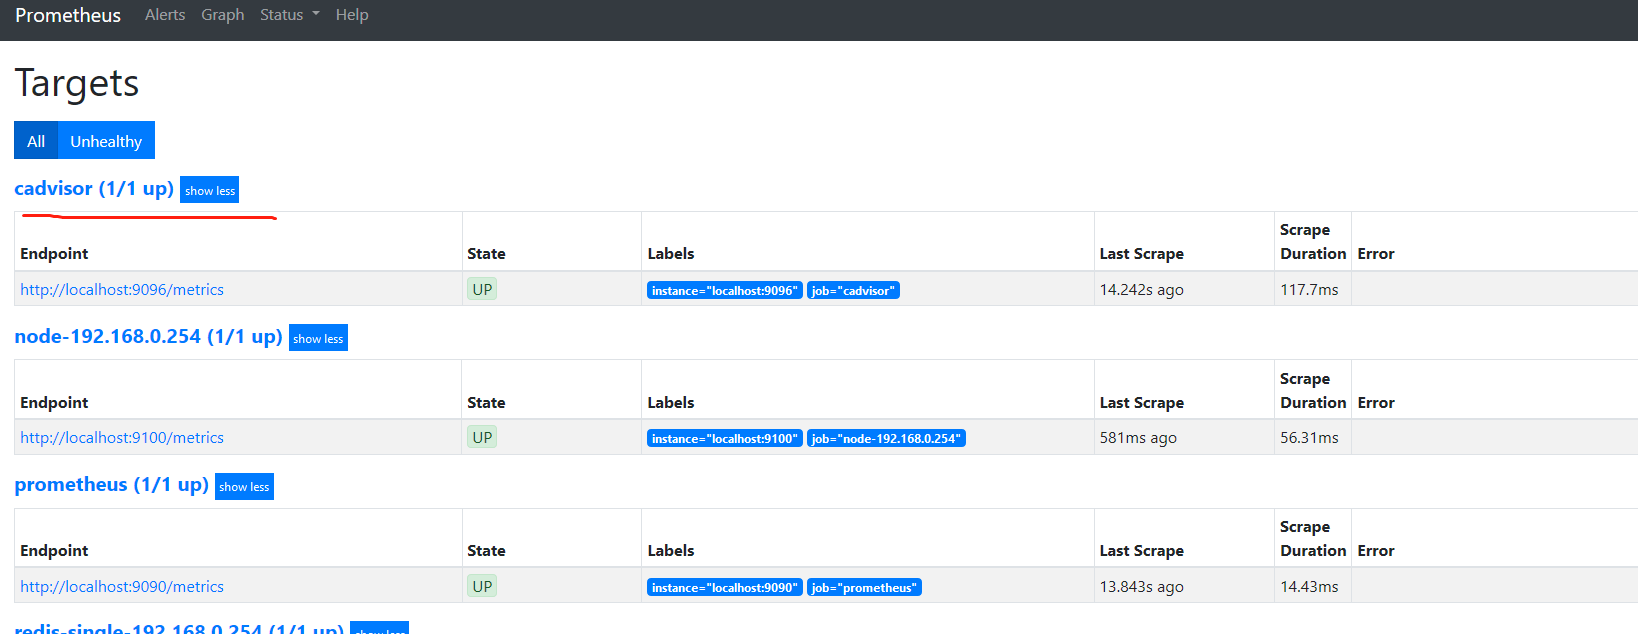
修改/etc/prometheus/prometheus.yml,将cAdvisor添加监控数据采集任务目标当中:
- job_name: cadvisor
  static_configs:
  - targets:
    - localhost:9096
重启Prometheus服务,查看