MLP建立
下面是对于手写数据集进行分类的代码,也是最为常用的代码
# ---------------------手写数据集-----------------------------
# 数据集
from keras.datasets import mnist
(X_train,y_train),(X_test,y_test) = mnist.load_data()
# 1 对于图片进行预处理
# 流量应该不是这样
# (60000,28,28) -> (60000,784)
img1 = X_train[0]
feature_size = img1.shape[0]*img1.shape[1]
X_train_format = X_train.reshape(X_train.shape[0],feature_size)
X_test_format = X_test.reshape(X_test.shape[0],feature_size)
# 归一化处理输入数据
X_train_normal = X_train_format/255
X_test_normal = X_test_format/255
# 输出结果归一化
from keras.utils import to_categorical
y_train_format = to_categorical(y_train)
y_test_format = to_categorical(y_test)
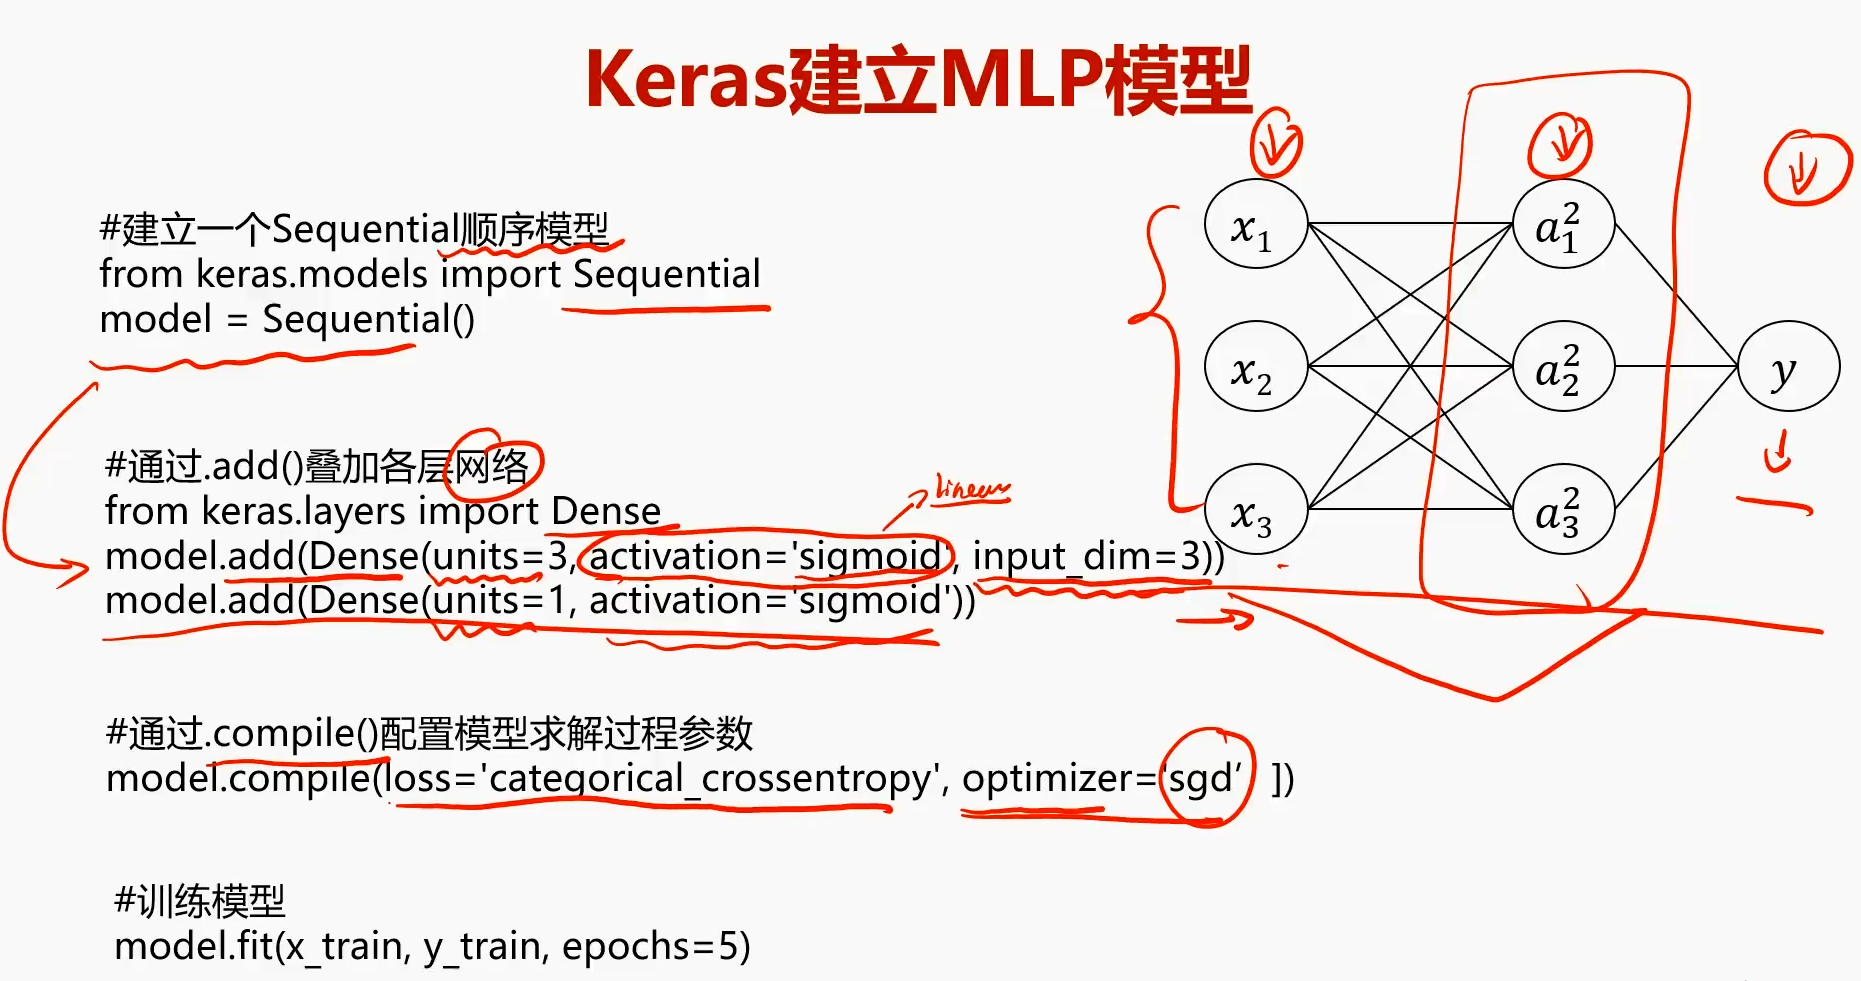
# 建立一个sequential顺序序列
from keras.models import Sequential
model = Sequential()
# 通过.add()叠加各层网络
from keras.layers import Dense
model.add(Dense(units=392,activation='sigmoid',input_dim=feature_size))
model.add(Dense(units=392,activation='sigmoid'))
model.add(Dense(units=10,activation='softmax'))
# 查看模型结构
model.summary()
# 通过compile 配置模型求解过程参数
model.compile(loss='categorical_crossentropy',
optimizer='adam',
metrics=['accuracy'])
# 训练模型
model.fit(X_train_normal,y_train_format,epochs=5)
# 评估
y_train_predict = model.predict_classes(X_train_normal)
print(y_train_predict)
from sklearn.metrics import accuracy_score
y_test_predict = model.predict_classes(X_test_normal)
accuracy_test = accuracy_score(y_test,y_test_predict)
print(accuracy_test)
# ------------------------使用shap查找有标签的特征贡献度--------------------------------
# import xgboost
import shap
def labelShap(model,X_train_normal):
shap.initjs()
explainer = shap.TreeExplainer(model)
shap_values = explainer.shap_values(X_train_normal)
shap.force_plot(explainer.expected_value, shap_values[0,:], X_train_normal.iloc[0,:])
# import shap
# import numpy as np
# background = X_train[np.random.choice(X_train.shape[0], 100, replace=False)]
#
# # explain predictions of the model on four images
# e = shap.DeepExplainer(model, background)
# # ...or pass tensors directly
# # e = shap.DeepExplainer((model.layers[0].input, model.layers[-1].output), background)
# shap_values = e.shap_values(X_test[1:5])
#
# # plot the feature attributions
# shap.image_plot(shap_values, -X_test[1:5])
流量分类的在下面的连接中:
https://github.com/SailorLee11/gan_bruteforce/blob/master/mlp_flow_classes.py
