梯度下降、随机梯度下降、方差减小的梯度下降(matlab实现)
梯度下降代码:
function [ theta, J_history ] = GradinentDecent( X, y, theta, alpha, num_iter )
m = length(y);
J_history = zeros(20, 1);
i = 0;
temp = 0;
for iter = 1:num_iter
temp = temp +1;
theta = theta - alpha / m * X' * (X*theta - y);
if temp>=100
temp = 0;
i = i + 1;
J_history(i) = ComputeCost(X, y, theta);
end
end
end
随机梯度下降代码:
function [ theta,J_history ] = StochasticGD( X, y, theta, alpha, num_iter )
m = length(y);
J_history = zeros(20, 1);
temp = 0;
n = 0;
for iter = 1:num_iter
temp = temp + 1;
index = randi(m);
theta = theta -alpha * (X(index, :) * theta - y(index)) * X(index, :)';
if temp>=100
temp = 0;
n = n + 1;
J_history(n) = ComputeCost(X, y, theta);
end
end
end
方差减小的梯度下降(SVRG):
function [ theta_old, J_history ] = SVRG( X, y, theta, alpha )
theta_old = theta;
n = length(y);
J_history = zeros(20,1);
m = 2 * n;
for i = 1:20
theta_ = theta_old;
Mu = 1/n * X' * (X*theta_ - y);
theta_0 = theta_;
for j = 1:m
index = randi(n);
GD_one = (X(index, :) * theta_0 - y(index)) * X(index, :)';
GD_ = (X(index, :) * theta_ - y(index)) * X(index, :)';
theta_t = theta_0 - alpha * (GD_one - GD_ + Mu);
theta_0 = theta_t;
end
J_history(i) = ComputeCost(X, y, theta_t);
theta_old = theta_t;
end
end
损失函数:
function J = ComputeCost( X, y, theta )
m = length(y);
J = sum((X*theta - y).^2) / (2*m);
end
主程序代码:
%% clean workspace
clc;
clear;
close all;
%% plot data
fprintf('plot data... \n');
X = load('ex2x.dat');
y = load('ex2y.dat');
m = length(y);
figure;
plot(X,y,'o');
%% gradient decent
fprintf('Runing gradient decent... \n');
X = [ones(m,1),X];
theta_SGD = zeros(2, 1);
theta_GD = zeros(2, 1);
theta_SVRG = zeros(2, 1);Iteration = 2000;
alpha = 0.015;
alpha1 = 0.025;[theta ,J]= StochasticGD(X, y, theta_SGD, alpha, Iteration);
[theta1 ,J1]= GradinentDecent(X, y, theta_GD, alpha, Iteration);
[theta2 ,J2]= SVRG(X, y, theta_SVRG, alpha1);fprintf('SGD: %f %f\n',theta(1),theta(2));
fprintf('GD: %f %f\n',theta1(1),theta1(2));
fprintf('SVRG: %f %f\n',theta2(1),theta2(2));hold on;
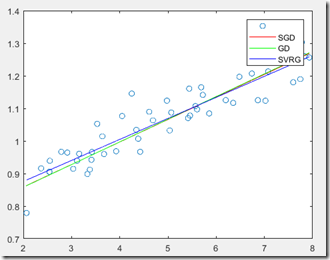
plot(X(:, 2), X*theta, 'r-');
plot(X(:, 2), X*theta1, 'g-');
plot(X(:, 2), X*theta2, 'b-');
legend('','SGD','GD','SVRG');x_j = 1:1:20;
figure;
hold on;
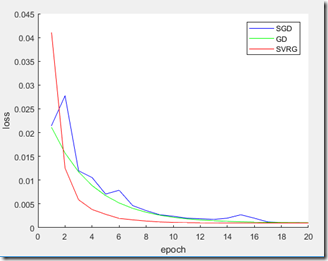
plot(x_j, J, 'b-');
plot(x_j, J1, 'g-');
plot(x_j, J2, 'r-');
legend('SGD','GD','SVRG');
xlabel('epoch')
ylabel('loss')
实验结果:


 浙公网安备 33010602011771号