Beginning Android Development
Tools:
| Tool | | Description |
| Required | The essential development tool. It contains the building system, utilities and document. | |
| Required | | |
| Eclipse with ADT plugin | Optional | It’s the officially recommended IDE to do android development. |
The installation of these tools is quite straight forward. Actually, they all support copy and run. The only requirement is $(Java SDK installation folder)/jdk/bin is added to %PATH% environment variable. I also add $(android sdk installation foler)/tools to %PATH% for easier access to android tools.
How tools work collaboratively
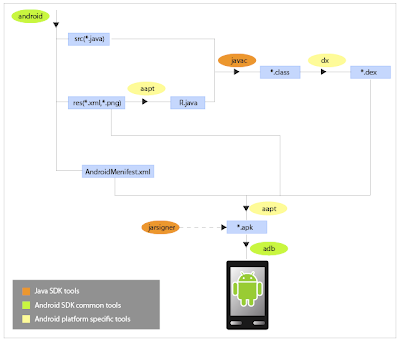
The SDK document includes basic development tutorials for eclipse and other IDEs. The figure below illustrates how android tools work collaboratively to create project, generate executable file and download to device/emulator.
All involved tools can be divided into three categories, android common tools, android platform specific tools and java sdk tools. Android common tools are placed in $(android sdk installation folder)/tools directory, and can be used across different android versions. Android platform specific tools are placed in $(android sdk installation folder)/platforms/android-VERSION/tools directory, and are used for a specific platform version. Java sdk tools come with the jdk installation.
When working in Eclipse, the ADT plugin invokes these tools automatically and makes them transparent to developers so that we enjoy a smooth developing experience.
How debugging tools work
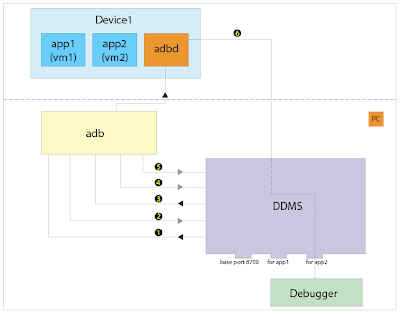
Being able to debug application on android platform is very essential. Android platform comes with a power debugging support on device/emulator. The DDMS tool works as the middleman between the debuggee running on device/emulator and debugger running on developing box. The architecture is:
The work flow is:
- DDMS connects to adb and starts device monitoring
- adb scans odd-numbered ports in range from 5555 to 5585 for new device and notifies DDMS it finds one
- DDMS starts VM monitoring for the new device
- adb discovers new VM and notifies DDMS
- DDMS retrieves process id via adb
- DDMS connects to the VM debugger through adb daemon(adbd) on the device
- debugging session starts
- DDMS opens a tcp port for receiving debugging commands and directs to the VM debugger
With knowledge above, we can issue below command to use the jdb debugger (contained in Java SDK) to perform debugging on a process.
jdb -connect com.sun.jdi.SocketAttach:hostname=localhost,port=8700
Before run this command, we must run DDMS process first.
Note that according to the example provided by jdb document, jdb can attach to a process in simpler form “jdb –attach 8700”. But when I did this on windows, I got the following error message:
java.io.IOException: shmemBase_attach failed: The system cannot find the file specified
It seems jdb is using shared memory other than socket, so I have to use the complex form.


