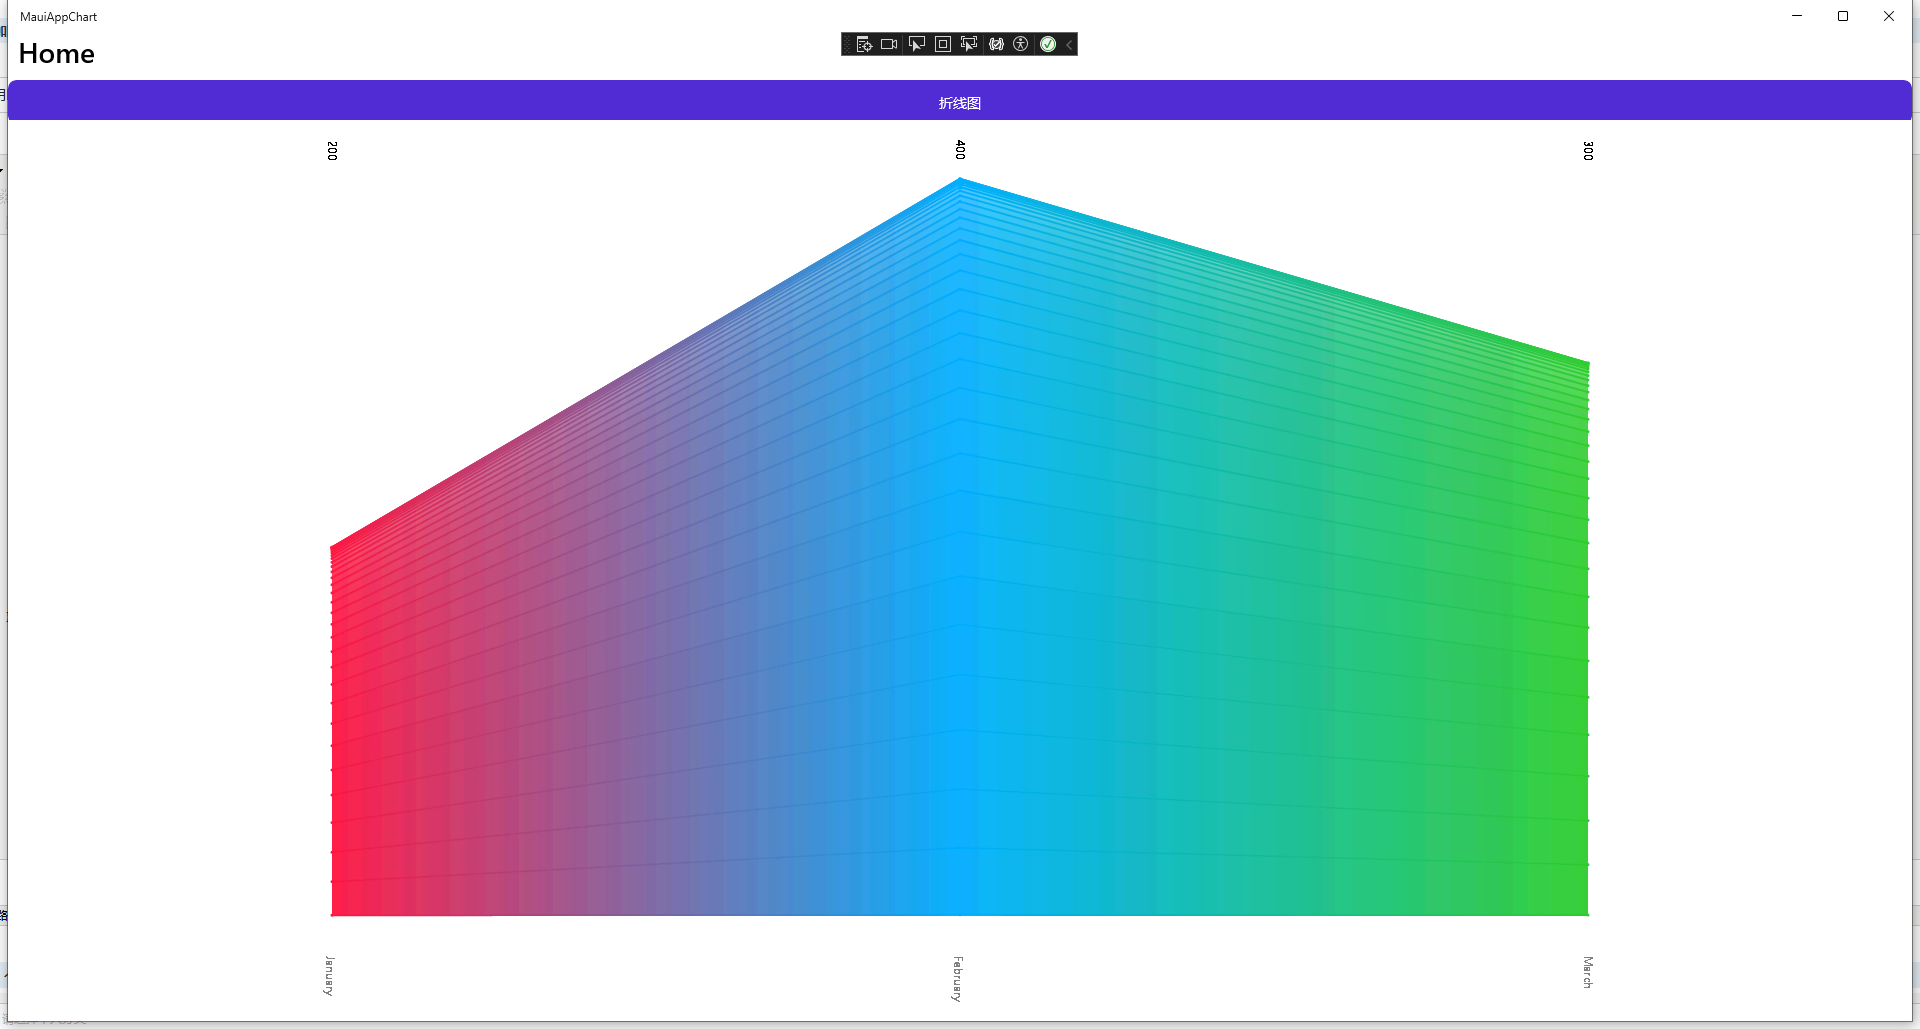
使用MAUI绘制图表
包 Microcharts.Maui
1.MauiProgram.cs
            var builder = MauiApp.CreateBuilder();
            builder
                .UseMauiApp<App>()
                   .UseSkiaSharp() //使用图表添加
                .ConfigureFonts(fonts =>
                {
                    fonts.AddFont("OpenSans-Regular.ttf", "OpenSansRegular");
                    fonts.AddFont("OpenSans-Semibold.ttf", "OpenSansSemibold");
                });

#if DEBUG
            builder.Logging.AddDebug();
#endif

            return builder.Build();
2.xaml
<?xml version="1.0" encoding="utf-8" ?>
<ContentPage xmlns="http://schemas.microsoft.com/dotnet/2021/maui"
             xmlns:x="http://schemas.microsoft.com/winfx/2009/xaml"
             xmlns:local="clr-namespace:MauiAppChart"
             xmlns:ct="clr-namespace:Microcharts.Maui;assembly=Microcharts.Maui"
             x:Class="MauiAppChart.MainPage">
    <Grid>
        <Grid.RowDefinitions>
            <RowDefinition Height="40"></RowDefinition>
            <RowDefinition Height="1*"></RowDefinition>
        </Grid.RowDefinitions>
        <Button Grid.Row="0" Text="折线图" Clicked="Button_Line"></Button>
        <Grid x:Name="ct" Grid.Row="1">
            <ct:ChartView x:Name="ctdata"></ct:ChartView>
        </Grid>
    </Grid>
</ContentPage>
3.cs
     var entries = new[]
{
     new Microcharts.ChartEntry(200)
     {
         Label = "January",
         ValueLabel = "200",
         Color = SKColor.Parse("#FF1943")
     },
     new Microcharts.ChartEntry(400)
     {
         Label = "February",
         ValueLabel = "400",
         Color = SKColor.Parse("#00B0FF")
     },
     new Microcharts.ChartEntry(300)
     {
         Label = "March",
         ValueLabel = "300",
         Color = SKColor.Parse("#32CD32")
     }
 };
     var chart = new LineChart
     {
         Entries = entries,
         LineMode = LineMode.Straight,
         LineSize = 2,
         PointSize = 3,
         LabelTextSize = 12,
         BackgroundColor = SKColors.Transparent,
     };
     ctdata.Chart= chart;


【推荐】国内首个AI IDE,深度理解中文开发场景,立即下载体验Trae
【推荐】编程新体验,更懂你的AI,立即体验豆包MarsCode编程助手
【推荐】抖音旗下AI助手豆包,你的智能百科全书,全免费不限次数
【推荐】轻量又高性能的 SSH 工具 IShell:AI 加持,快人一步
· TypeScript + Deepseek 打造卜卦网站:技术与玄学的结合
· Manus的开源复刻OpenManus初探
· AI 智能体引爆开源社区「GitHub 热点速览」
· 三行代码完成国际化适配,妙~啊~
· .NET Core 中如何实现缓存的预热?