echarts动态曲线(以秒为单位)每秒都往后移效果


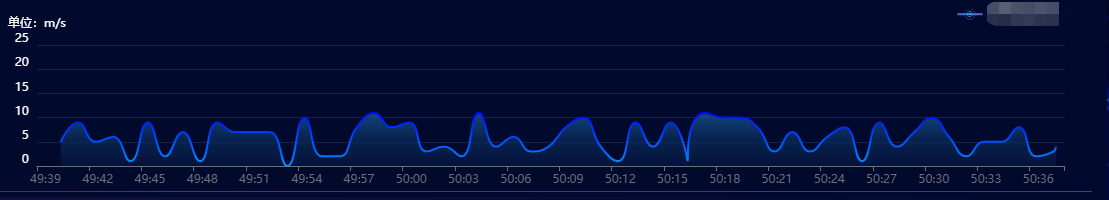
这是一个可以监控每秒物体运动速度、数量的实时动态曲线图。思路是定时器控制,每秒新增一个在末尾,去掉一个在首个。来达到不断往后移的效果。

话不多说,直接上代码:

data: {

        data:[],

    },

    mounted() {

        this.operation_data_barFn();

    },

    methods: {

        //随机

        randomData() {

            var now = +new Date();

            var oneDay = 100;

            var value = Math.random() * 10;

            now = new Date(+now + oneDay);

            value = value + Math.random() ;

            var valueName = now.getFullYear() + '/' + (now.getMonth() + 1) + '/' + now.getDate() +

                ' ' + (now.getHours() >= 10 ? now.getHours() : '0' + now.getHours()) + ':' +

                (now.getMinutes() >= 10 ? now.getMinutes() : '0' + now.getMinutes()) +

                ':' + (now.getSeconds() >= 10 ? now.getSeconds() : '0' + now.getSeconds());

            console.log(valueName,'valueName')

            return {

                name: valueName,

                value: [

                    valueName,

                    Math.round(value)

                ]

            }

        },

        //运行数据动态时间轴 (以秒为单位)

        operation_data_barFn() {

            var _this = this;

            for (var i = 0; i < 60; i++) {

                _this.data.push(_this.randomData());

            }

            var dom24 = document.getElementById("operation_data_bar");//这里替换你的echarts的id

            var myChart24 = echarts.init(dom24);

            let option = null;

            option = {

                title: {

                    left: 'center',

                    text: '',

                },

                tooltip: {

                    trigger: 'axis',

                    axisPointer: {

                        type: 'line',

                        label: {

                            backgroundColor: '#6a7985'

                        },

                        lineStyle: {

                            color: '#00FF34'

                        }

                    },

                    formatter: function (params) {

                        params = params[0];

                        var date = new Date(params.name);

                        return '时间:'+date.getMinutes() + ':' + date.getSeconds()  + '<br/>速度 : ' + params.value[1];

                    },

                    axisPointer: {

                        animation: true

                    }               

                },

                //位置

                grid: {

                    left: '5%',

                    right: '3%',

                    top: '20%',

                    bottom:'25%'

                },

                //图例名

                legend: {

                    top: '1%',

                    right: '3%',

                    textStyle: {

                        color: '#ffffff',

                    }

                },       

                xAxis: {

                    type: 'category',

                    splitLine: {

                        show: false

                    },

                    axisLabel: {

                        formatter: function (value) {

                            //console.log(value,'value')

                            return value.substring(13, value.length)

                        }

                    },

                    triggerEvent: true

                },

                yAxis: {

                    name: '单位:m/s',

                    type: 'value',

                    boundaryGap: [0, '100%'],

                    splitLine: {

                        show: false

                    },

                    axisLine: {

                        lineStyle: {

                            color: '#fff',//左边线的颜色

                            width: '1'//坐标线的宽度

                        }

                    },

                    axisTick: {

                        inside: true

                    },

                    splitLine: { //横线颜色

                        show: true,

                        lineStyle: {

                            color: ['#192148'],

                            width: 1,

                            type: 'solid'

                        }

                    },

                    axisLabel: {

                        inside: false,

                        formatter: '{value}\n'

                    }

                },

                series: [{

                    name: '速度曲线',

                    type: 'line',

                    smooth: true,

                    showSymbol: false,

                    hoverAnimation: false,

                    symbol: 'image://../images/circle_s.png',//鼠标悬停线上的圆点样式(可替换本地图片,也可删除,不然会报错啦)

                    symbolSize: 20,

                    itemStyle: {

                        color: '#6A5ACD',

                        normal: {

                            lineStyle: {// 系列级个性化折线样式

                                width: 1,

                                type: 'solid',

                                color: new echarts.graphic.LinearGradient(0, 0, 0, 1, [{

                                    offset: 0,

                                    color: '#0000FF'

                                }, {

                                    offset: 1,

                                    color: '#0096FF'

                                }]),//线条渐变色

                            }

                        },

                        emphasis: {

                            color: '#00FF34',

                            borderWidth: 3,

                            borderColor: '#00FF34',

                        }

                    },//线条样式

                    areaStyle: {

                        normal: {

                            //颜色渐变函数 前四个参数分别表示四个位置依次为左、下、右、上

                            color: new echarts.graphic.LinearGradient(0, 0, 0, 1, [{

                                offset: 0,

                                color: 'RGB(24,93,158)'

                            }, {

                                offset: .50,

                                color: 'RGB(12,45,95)'

                            }, {

                                offset: 1,

                                color: 'RGB(6,22,64)'

                            }])

                        }

                    },//区域颜色渐变

                    data: _this.data,

                }]

            };

            //定时器

            setInterval(function () {

                _this.data.shift();

                console.log(_this.randomData(),'_this.randomData()')

                _this.data.push(_this.randomData());

                myChart24.setOption(option, true);

            }, 1000);

        }

}


posted @ 2022-02-22 11:45  如意酱  阅读(1760)  评论(0编辑  收藏  举报