路径选择
一、
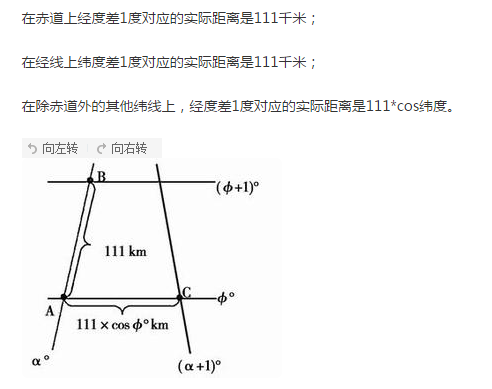
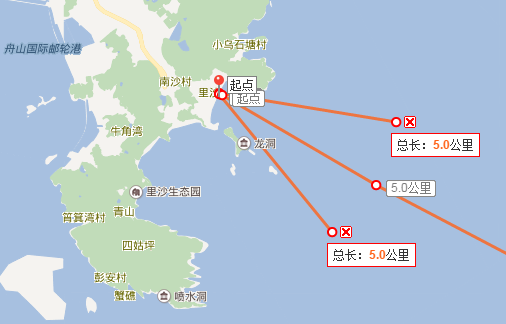
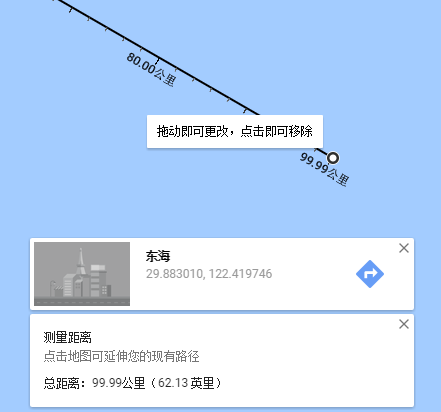
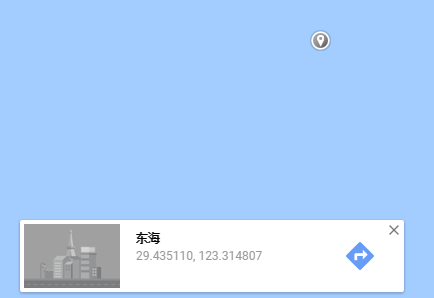
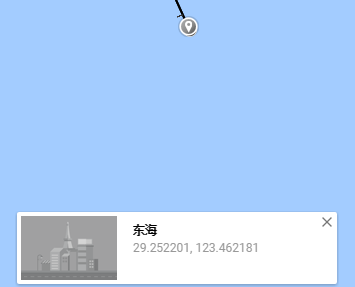
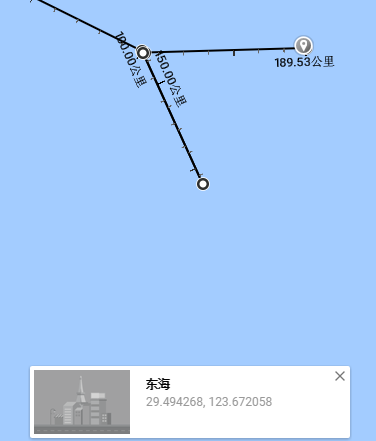
二、计算坐标
clear all
%%
%输入值
d1=5;
d2=100;
d3=30;
d4=30;
thiet=125;
%%
%系统值
lon=110*cos(3.14*29.8/180);
lat=110;
x0=122.4189;y0=29.8824;%经纬度
%%
%计算第一个坐标
x1=x0+d1*cos((90-thiet)/180)/lon;
y1=y0+d1*sin((90-thiet)/180)/lat;
%计算第二个坐标
x2=x1+d2*cos((90-thiet)/180)/lon;
y2=y1+d2*sin((90-thiet)/180)/lat;
%第三个坐标
thiet_3=thiet-30;
x3=x2+d3*cos((90-thiet_3)/180)/lon;
y3=y2+d3*sin((90-thiet_3)/180)/lat;
%第四个坐标
thiet_4=thiet+30;
x4=x2+d4*cos((90-thiet_4)/180)/lon;
y4=y2+d4*sin((90-thiet_4)/180)/lat;
%%
%展示
X_1=[x0,x1,x2,x3];
Y_1=[y0,y1,y2,y3];
X_2=[x0,x1,x2,x4];
Y_2=[y0,y1,y2,y4];
plot(X_1,Y_1,'o-',X_2,Y_2,'o-')
grid on

disp(['第一个点经度为lon=',num2str(x1),',纬度为lat=',num2str(y1)]);
disp(['第二个点经度为lon=',num2str(x2),',纬度为lat=',num2str(y2)]);
disp(['第三个点经度为lon=',num2str(x3),',纬度为lat=',num2str(y3)]);
disp(['第四个点经度为lon=',num2str(x4),',纬度为lat=',num2str(y4)]);
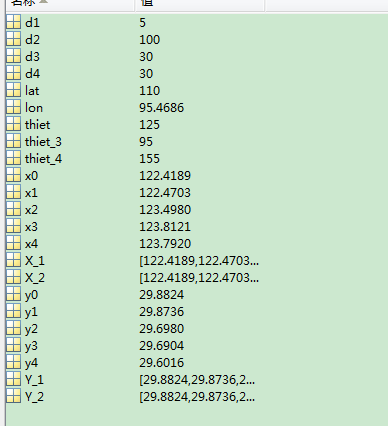
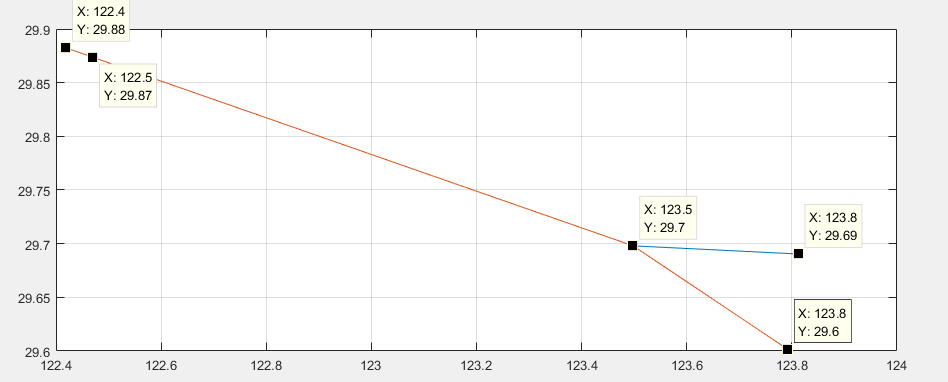

改成函数形式
function [X,Y]=ROAD(d1,d2,d3,d4,thiet)
%%
%输入值
% d1=5;
% d2=100;
% d3=30;
% d4=30;
% thiet=125;
%%
%系统值
lon=110*cos(3.14*29.8/180);
lat=110;
x0=122.4189;y0=29.8824;%经纬度
%%
%计算第一个坐标
x1=x0+d1*cos((90-thiet)/180)/lon;
y1=y0+d1*sin((90-thiet)/180)/lat;
%计算第二个坐标
x2=x1+d2*cos((90-thiet)/180)/lon;
y2=y1+d2*sin((90-thiet)/180)/lat;
%第三个坐标
thiet_3=thiet-30;
x3=x2+d3*cos((90-thiet_3)/180)/lon;
y3=y2+d3*sin((90-thiet_3)/180)/lat;
%第四个坐标
thiet_4=thiet+30;
x4=x2+d4*cos((90-thiet_4)/180)/lon;
y4=y2+d4*sin((90-thiet_4)/180)/lat;

%%
%展示
X_1=[x0,x1,x2,x3];
Y_1=[y0,y1,y2,y3];
X_2=[x0,x1,x2,x4];
Y_2=[y0,y1,y2,y4];
plot(X_1,Y_1,'o-',X_2,Y_2,'o-')
grid on

X=[x1,x2,x3,x4]
Y=[y1,y2,y3,y4]

disp(['第一个点经度为lon=',num2str(x1),',纬度为lat=',num2str(y1)]);
disp(['第二个点经度为lon=',num2str(x2),',纬度为lat=',num2str(y2)]);
disp(['第三个点经度为lon=',num2str(x3),',纬度为lat=',num2str(y3)]);
disp(['第四个点经度为lon=',num2str(x4),',纬度为lat=',num2str(y4)]);
三、地图显示
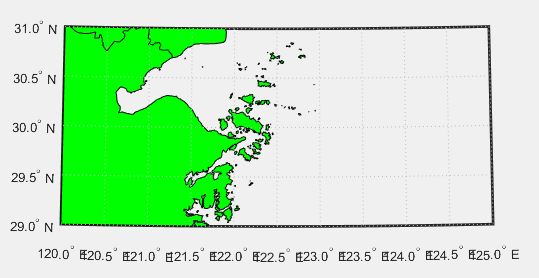
(1)
clear all
ax=worldmap([29 31],[120 125]);%载入地图
geoshow(ax,'maps\bou2_4p.shp','FaceColor','G')%将边界线载入地图中
clear all
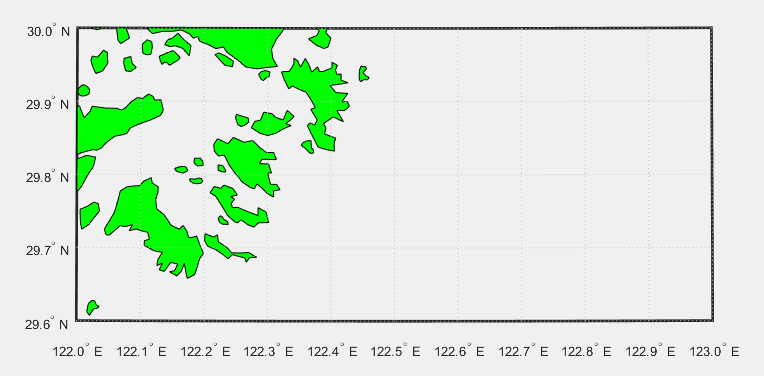
ax=worldmap([29.6 30],[122 123]);%载入地图
geoshow(ax,'maps\bou2_4p.shp','FaceColor','G')%将边界线载入地图中
(2)利用M_map库来生成地图
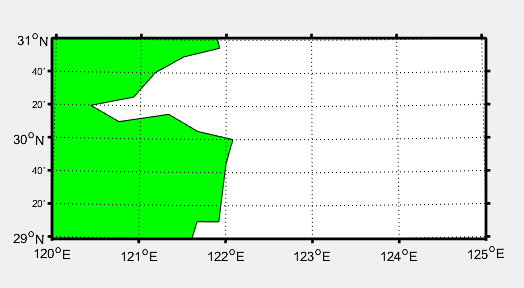
低精度的海岸线
clear all
m_proj('albers equal-area','lat',[29 31],'long',[120 125],'rect','on');%方形,扇形
m_coast('patch',[0 1 0]);%填充
m_grid('linewidth',2,'tickdir','out');
(3)安装高精度数据
How to install GSHHS:
- Go to http://www.ngdc.noaa.gov/mgg/shorelines/data/gshhs/.
- Get and uncompress any or all of the files
gshhs_c.b.gz, gshhs_l.b.gz, gshhs_i.b.gzand/orgshhs_h.b.gzin a convenient directory. One useful place is inm_map/private. GSHHS data format has changed between v1.2 and 1.3, and again for v2.0, but m_map should be able to figure this out. - If the database files are not in subdirectory
m_map/private, you must edit theFILNAMEsettings inm_gshhs_c.m, m_gshhs_l.m, m_gshhs_i.m, m_gshhs_h.mand/orm_gshhs_f.mto point to the appropriate files.
1、下载数据
https://www.ngdc.noaa.gov/mgg/shorelines/data/gshhg/oldversions/
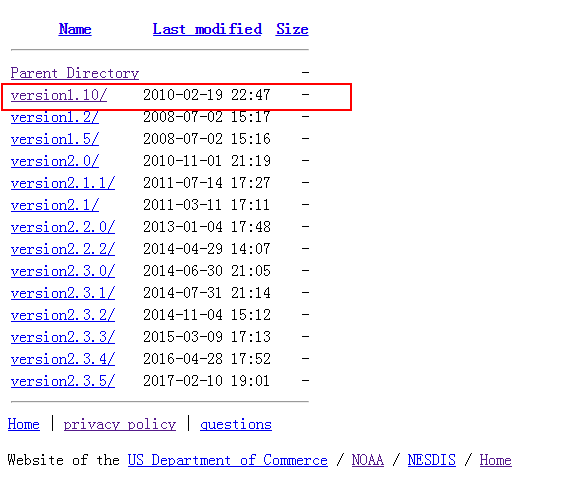
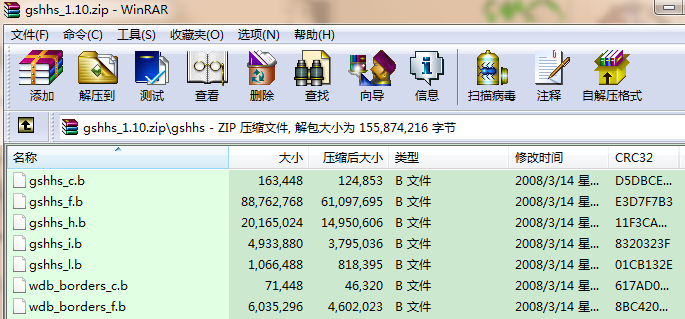
选择版本一定是1.0的,否则不能用(翻译里的内容是个坑)
解压后如下图
而2.0的解压后后缀名变了,如下
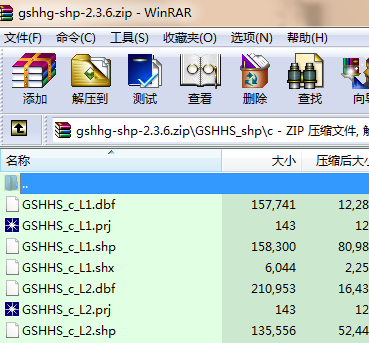
而程序中只认*.b的后缀名。
2、将gshhs数据解压安装在路径D:\MATLAB\toolbox\m_map\private\gshhs中

在MATLAB中将该文件添加路径

3、接下来更该m_map文件夹下程序中路径名,如下图。所有都要更改
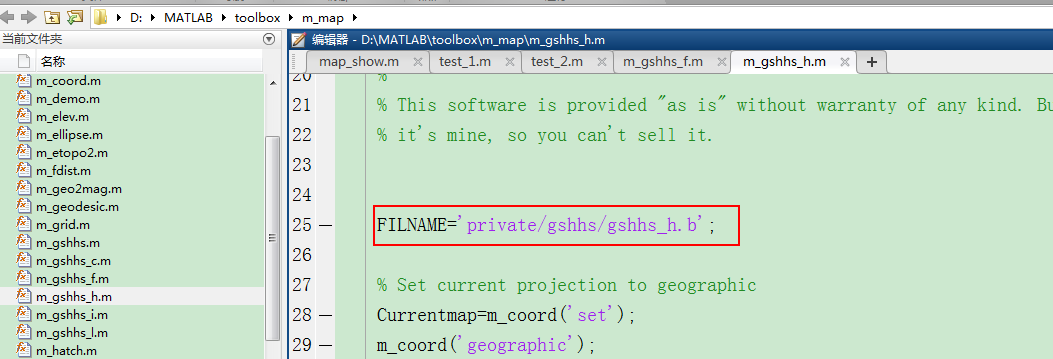
以上将gshhs数据包安装完毕。
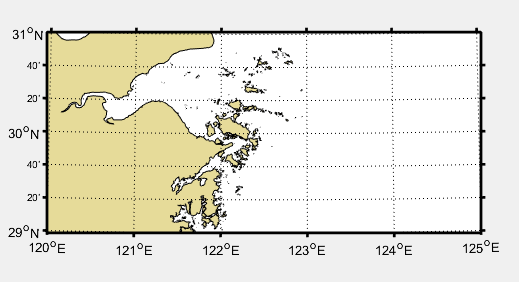
(4)高精度数据显示
clear all

m_proj('albers equal-area','lat',[29 31],'long',[120 125],'rect','on');
m_gshhs_h('patch',[0.9 .86 .6]);
m_grid('linewidth',2,'tickdir','out');
clear all

m_proj('albers equal-area','lat',[29.6 30],'long',[122 123],'rect','on');
m_gshhs_h('patch',[0.9 .86 .6]);
m_grid('linewidth',2,'tickdir','out');
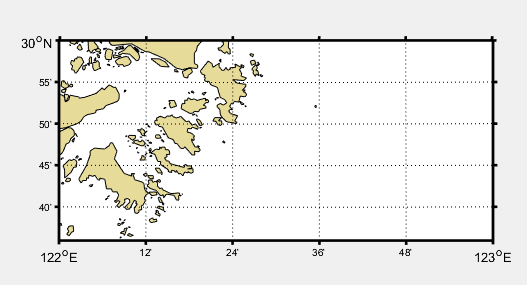
明显精度提高了许多
(5)优化
clear all
m_proj('albers equal-area','lat',[29 31],'long',[120 125],'rect','on');%方形,扇形
m_gshhs_h('save','gumby');
将该区域的数据保存下来,供以后直接调用,可节约时间
clear all
m_proj('albers equal-area','lat',[29 31],'long',[120 125],'rect','on');%方形,扇形
load gumby
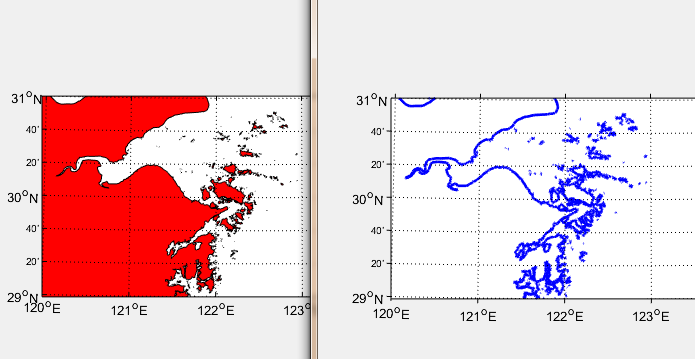
figure(1);
m_usercoast('gumby','patch','r');
m_grid;

figure(2);
m_usercoast('gumby','linewidth',2,'color','b');
m_grid('tickdir','out','yaxisloc','left');
clear all
% load s
tic
m_proj('albers equal-area','lat',[29 31],'long',[120 125],'rect','on');
m_gshhs_h('patch',[0.9 .86 .6]);
m_grid('linewidth',2,'tickdir','out');

% m_line(X,Y,'linewi',2,'color','r');%线宽,2;颜色
toc

clear all
tic
m_proj('albers equal-area','lat',[29 31],'long',[120 125],'rect','on');%方形,扇形
load gumby
m_usercoast('gumby','patch',[0.9 .86 .6]);
m_grid;
toc

四、路径显示在图上
clear all
load s
m_proj('albers equal-area','lat',[29 31],'long',[120 125],'rect','on');%方形,扇形
load gumby
m_usercoast('gumby','patch',[0.9 .86 .6]);
m_grid;
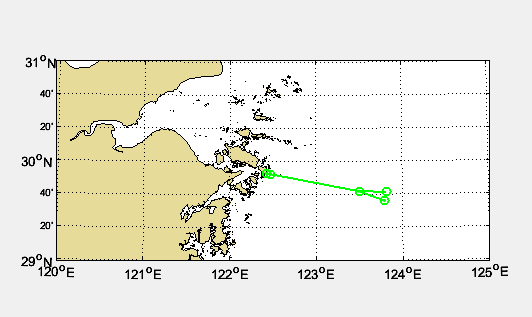
m_line(X_1,Y_1,'linewi',1.5,'color','g','Marker','o','LineStyle','-');%线宽,2;颜色
m_line(X_2,Y_2,'linewi',1.5,'color','g','Marker','o','LineStyle','-');%线宽,2;颜色
clear all
%%
%输入值
d1=5;%第一段距离
d2=100;%第二段距离
d3=30;%第三段距离
d4=d3;%第四段距离
thiet=125;%初始角度
[X_1,Y_1,X_2,Y_2]=ROAD(d1,d2,d3,d4,thiet);%调用函数
%%
m_proj('albers equal-area','lat',[29.5 30.5],'long',[122 124],'rect','on');%方形,扇形
load gumby%载入地图数据
m_usercoast('gumby','patch',[0.9 .86 .6]);
m_grid;
m_line(X_1,Y_1,'linewi',1.5,'color','g','Marker','o','LineStyle','-');%线宽,2;颜色
m_line(X_2,Y_2,'linewi',1.5,'color','g','Marker','o','LineStyle','-');%线宽,2;颜色
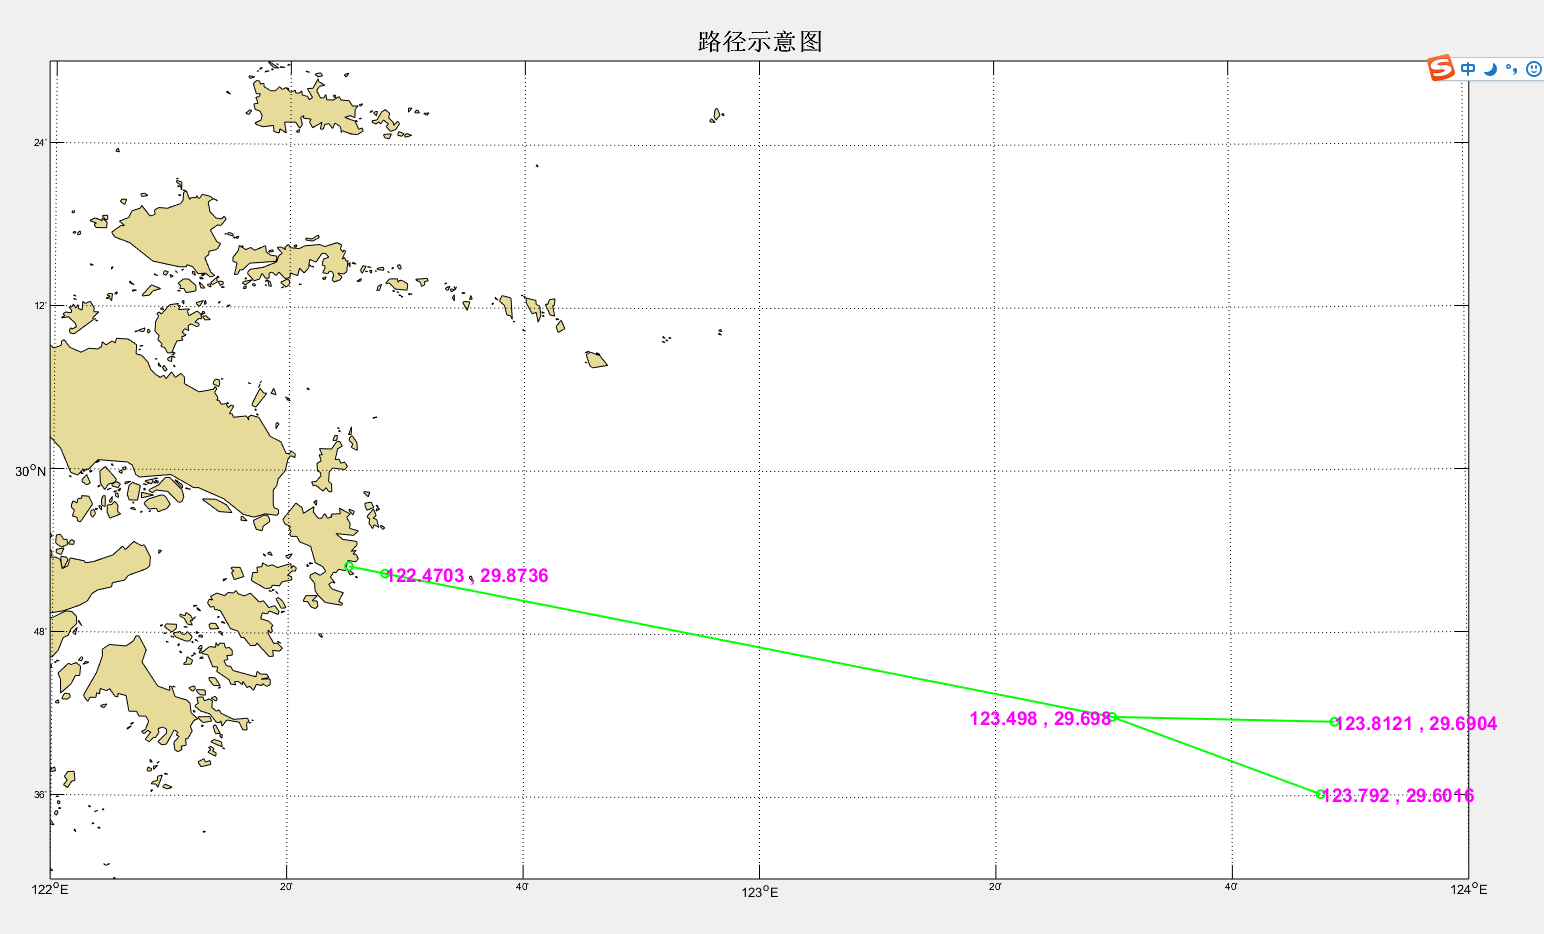
title('路径示意图','fontsize',18,'fontweight','bold');
m_text(X_1(2),Y_1(2),[num2str(X_1(2)) ' , ' num2str(Y_1(2))],'fontweight','bold','color','m','fontsize',14);
m_text(X_1(3),Y_1(3),[num2str(X_1(3)) ' , ' num2str(Y_1(3))],'fontweight','bold','color','m','fontsize',14,'Horizontal','right');
m_text(X_1(4),Y_1(4),[num2str(X_1(4)) ' , ' num2str(Y_1(4))],'fontweight','bold','color','m','fontsize',14);
m_text(X_2(4),Y_2(4),[num2str(X_2(4)) ' , ' num2str(Y_2(4))],'fontweight','bold','color','m','fontsize',14);
四、度分秒转换
function [str]=DMS(deg)

ang=floor(deg);
m=roundn((deg-ang)*60,-2);%保留两位小数
str=[num2str(ang) ' \circ ' num2str(m)];%显示度的符号
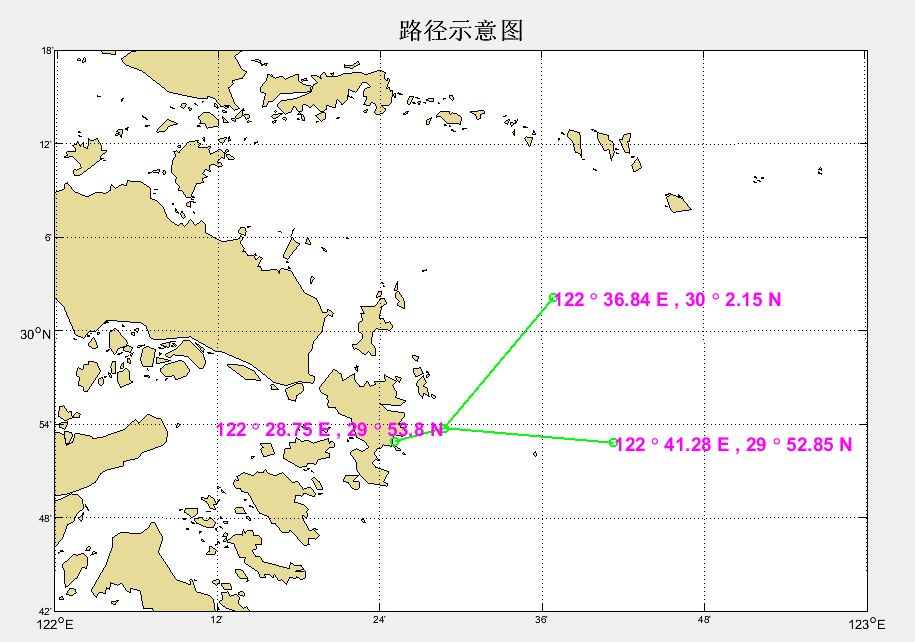
clear all
%%
%输入值
d1=6;%第一段距离
d2=0;%第二段距离
d3=20;%第三段距离
d4=20;%第四段距离
thiet=75;%初始角度
[X_1,Y_1,X_2,Y_2]=ROAD(d1,d2,d3,d4,thiet);%调用函数
%%
m_proj('albers equal-area','lat',[29.7 30.3],'long',[122 123],'rect','on');%方形,扇形
load gumby%载入地图数据
m_usercoast('gumby','patch',[0.9 .86 .6]);
m_grid;
m_line(X_1,Y_1,'linewi',1.5,'color','g','Marker','o','LineStyle','-');%线宽,2;颜色
m_line(X_2,Y_2,'linewi',1.5,'color','g','Marker','o','LineStyle','-');%线宽,2;颜色
title('路径示意图','fontsize',18,'fontweight','bold');
%m_text(X_1(2),Y_1(2),[num2str(X_1(2)) ' , ' num2str(Y_1(2))],'fontweight','bold','color','m','fontsize',14);%将度数,经纬度标志加入
m_text(X_1(3),Y_1(3),[DMS(X_1(3)) ' E , ' DMS(Y_1(3)) ' N'],'fontweight','bold','color','m','fontsize',14,'Horizontal','right');
m_text(X_1(4),Y_1(4),[DMS(X_1(4)) ' E , ' DMS(Y_1(4)) ' N'],'fontweight','bold','color','m','fontsize',14);
m_text(X_2(4),Y_2(4),[DMS(X_2(4)) ' E , ' DMS(Y_2(4)) ' N'],'fontweight','bold','color','m','fontsize',14);
五、GUI设计
(1)
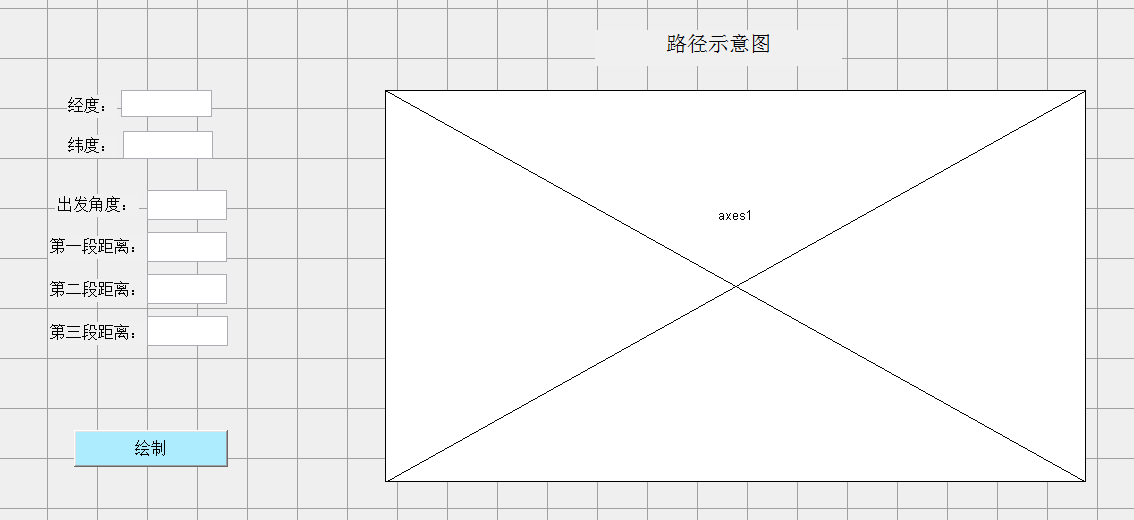
function pushbutton1_Callback(hObject, eventdata, handles)
% hObject    handle to pushbutton1 (see GCBO)
% eventdata  reserved - to be defined in a future version of MATLAB
% handles    structure with handles and user data (see GUIDATA)
cla reset%重置
axes(handles.axes1);
m_proj('albers equal-area','lat',[29 30.5],'long',[122 124],'rect','on');%方形,扇形
m_usercoast('gumby','patch',[0.9 .86 .6]);
m_grid; %基本地图

lon=110*cos(3.14*29.9/180);
lat=110;%当地经纬度1度距离

x0=str2num(get(handles.lon,'String'));
y0=str2num(get(handles.lat,'String'));%经纬度
thiet=str2num(get(handles.angle,'String'));%初始角度
d1=str2num(get(handles.des1,'String'));%第一段距离
d2=str2num(get(handles.des2,'String'));%第二段距离
d3=str2num(get(handles.des3,'String'));%第三段距离
d4=str2num(get(handles.des3,'String'));%第四段距离

%计算第一个坐标
x1=x0+d1*cos(3.14*(90-thiet)/180)/lon;
y1=y0+d1*sin(3.14*(90-thiet)/180)/lat;
%计算第二个坐标
x2=x1+d2*cos(3.14*(90-thiet)/180)/lon;
y2=y1+d2*sin(3.14*(90-thiet)/180)/lat;
%第三个坐标
thiet_3=thiet-35;
x3=x2+d3*cos(3.14*(90-thiet_3)/180)/lon;
y3=y2+d3*sin(3.14*(90-thiet_3)/180)/lat;
%第四个坐标
thiet_4= thiet+20;
x4=x2+d4*cos(3.14*(90-thiet_4)/180)/lon;
y4=y2+d4*sin(3.14*(90-thiet_4)/180)/lat;

X_1=[x0,x1,x2,x3];
Y_1=[y0,y1,y2,y3];
X_2=[x0,x1,x2,x4];
Y_2=[y0,y1,y2,y4];%数据点集合到一块

m_line(X_1,Y_1,'linewi',1.5,'color','g','Marker','o','LineStyle','-');%线宽,2;颜色
m_line(X_2,Y_2,'linewi',1.5,'color','g','Marker','o','LineStyle','-');%线宽,2;颜色

m_text(X_1(2),Y_1(2),[num2str(X_1(2)) ' , ' num2str(Y_1(2))],'fontweight','bold','color','m','fontsize',14);
m_text(X_1(3),Y_1(3),[num2str(X_1(3)) ' , ' num2str(Y_1(3))],'fontweight','bold','color','m','fontsize',14,'Horizontal','right');
m_text(X_1(4),Y_1(4),[num2str(X_1(4)) ' , ' num2str(Y_1(4))],'fontweight','bold','color','m','fontsize',14);
m_text(X_2(4),Y_2(4),[num2str(X_2(4)) ' , ' num2str(Y_2(4))],'fontweight','bold','color','m','fontsize',14);
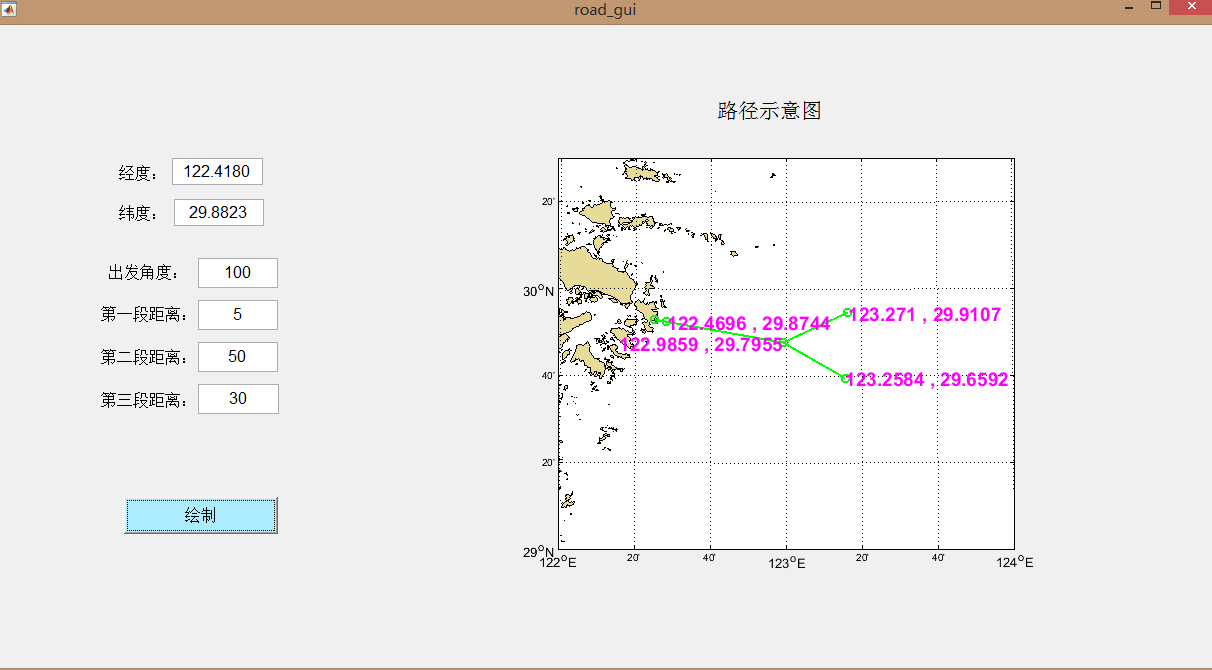
(2)添加角度函数
将角度转换函数加到最后,和普通的MATLAB调用程序一样
function [str]=DMS(deg)

ang=floor(deg);
m=roundn((deg-ang)*60,-2);
str=[num2str(ang) ' \circ ' num2str(m)];
%主函数
function pushbutton1_Callback(hObject, eventdata, handles)
% hObject    handle to pushbutton1 (see GCBO)
% eventdata  reserved - to be defined in a future version of MATLAB
% handles    structure with handles and user data (see GUIDATA)
cla reset
axes(handles.axes1);
m_proj('albers equal-area','lat',[29 30.5],'long',[122 124],'rect','on');%方形,扇形
m_usercoast('gumby','patch',[0.9 .86 .6]);
m_grid; %基本地图

lon=110*cos(3.14*29.9/180);
lat=110;%当地经纬度1度距离

x0=str2num(get(handles.lon,'String'));
y0=str2num(get(handles.lat,'String'));%经纬度
thiet=str2num(get(handles.angle,'String'));%初始角度
d1=str2num(get(handles.des1,'String'));%第一段距离
d2=str2num(get(handles.des2,'String'));%第二段距离
d3=str2num(get(handles.des3,'String'));%第三段距离
d4=str2num(get(handles.des3,'String'));%第四段距离

%计算第一个坐标
x1=x0+d1*cos(3.14*(90-thiet)/180)/lon;
y1=y0+d1*sin(3.14*(90-thiet)/180)/lat;
%计算第二个坐标
x2=x1+d2*cos(3.14*(90-thiet)/180)/lon;
y2=y1+d2*sin(3.14*(90-thiet)/180)/lat;
%第三个坐标
thiet_3=thiet-35;
x3=x2+d3*cos(3.14*(90-thiet_3)/180)/lon;
y3=y2+d3*sin(3.14*(90-thiet_3)/180)/lat;
%第四个坐标
thiet_4= thiet+20;
x4=x2+d4*cos(3.14*(90-thiet_4)/180)/lon;
y4=y2+d4*sin(3.14*(90-thiet_4)/180)/lat;

X_1=[x0,x1,x2,x3];
Y_1=[y0,y1,y2,y3];
X_2=[x0,x1,x2,x4];
Y_2=[y0,y1,y2,y4];%数据点集合到一块

m_line(X_1,Y_1,'linewi',1.5,'color','g','Marker','o','LineStyle','-');%线宽,2;颜色
m_line(X_2,Y_2,'linewi',1.5,'color','g','Marker','o','LineStyle','-');%线宽,2;颜色

m_text(X_1(2),Y_1(2),[num2str(DMS(X_1(2))) ' , ' num2str(DMS(Y_1(2)))],'fontweight','bold','color','m','fontsize',14,'Horizontal','right');
m_text(X_1(3),Y_1(3),[num2str(X_1(3)) ' , ' num2str(Y_1(3))],'fontweight','bold','color','m','fontsize',14,'Horizontal','right');
m_text(X_1(4),Y_1(4),[num2str(DMS(X_1(4))) ' , ' num2str(DMS(Y_1(4)))],'fontweight','bold','color','m','fontsize',14);
m_text(X_2(4),Y_2(4),[num2str(X_2(4)) ' , ' num2str(Y_2(4))],'fontweight','bold','color','m','fontsize',14);
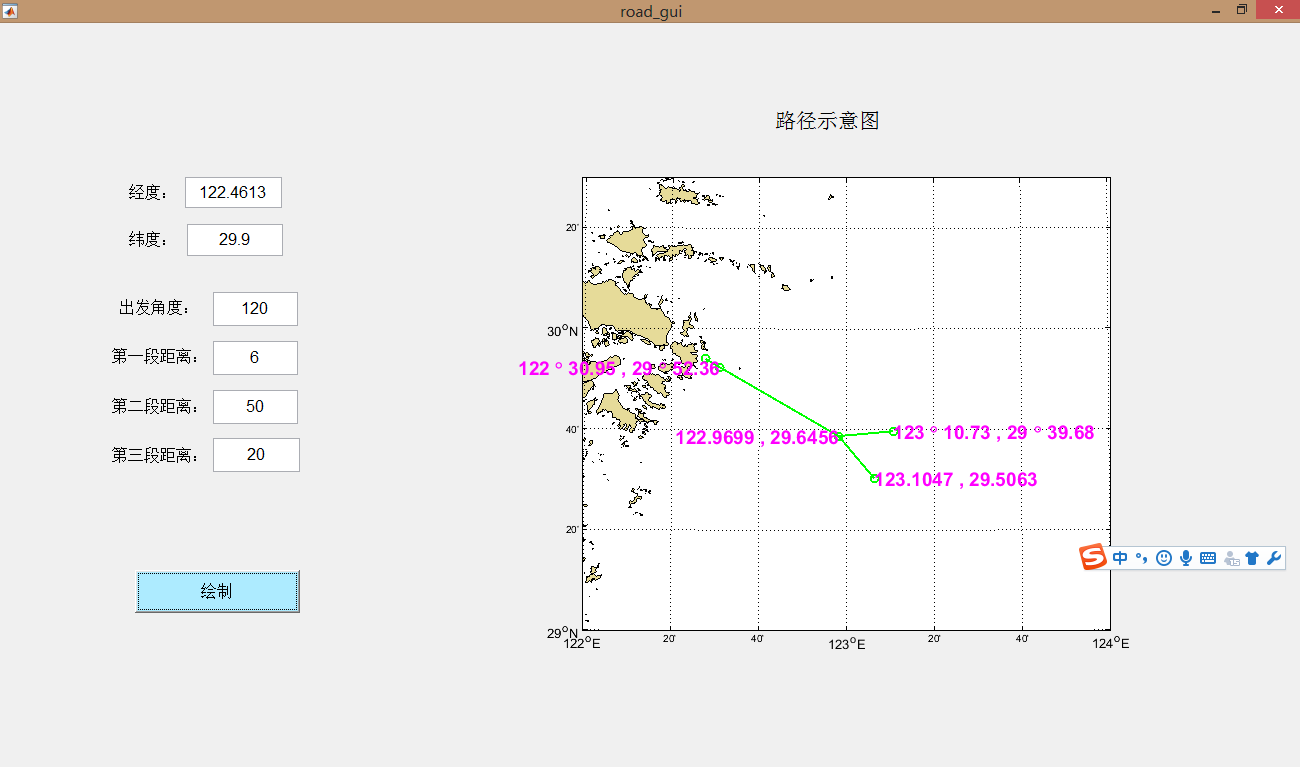
小数和角度同时显示的图
(3)gui转exe


运行之后新生成了很多文件,其中就有应用程序。双击
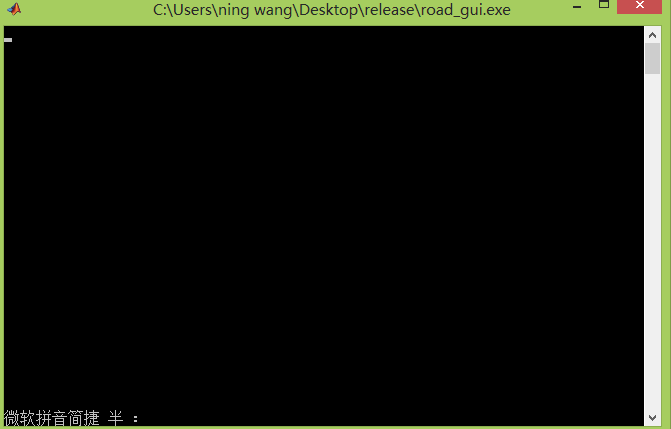
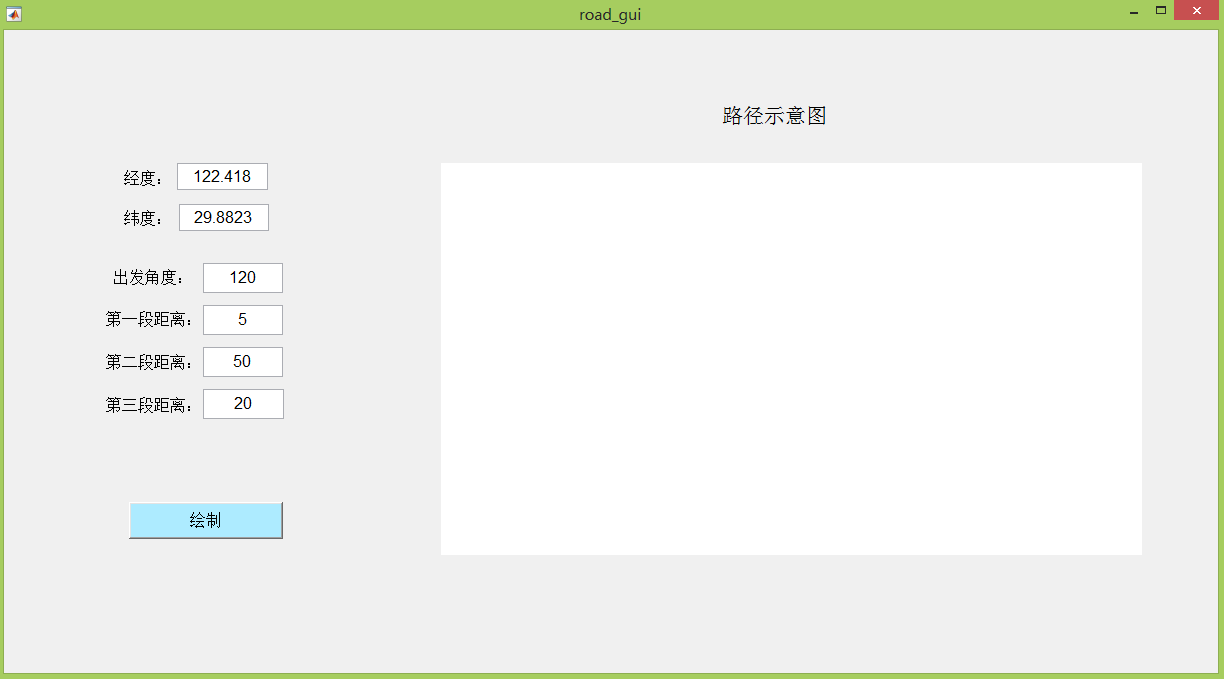
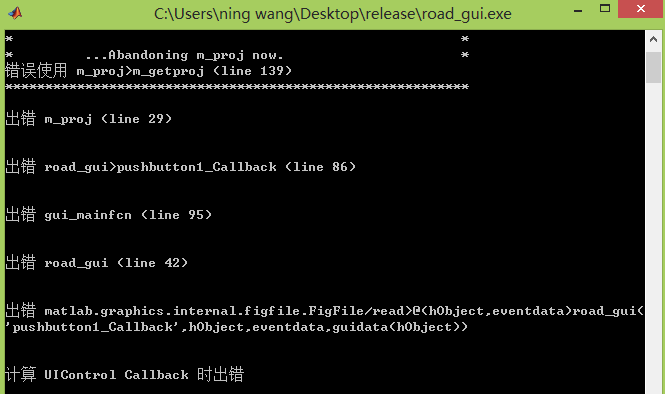
出错的原因是m_map地图包不能兼容。


