
MATLAB——时间,日期及显示格式
一、日期和时间
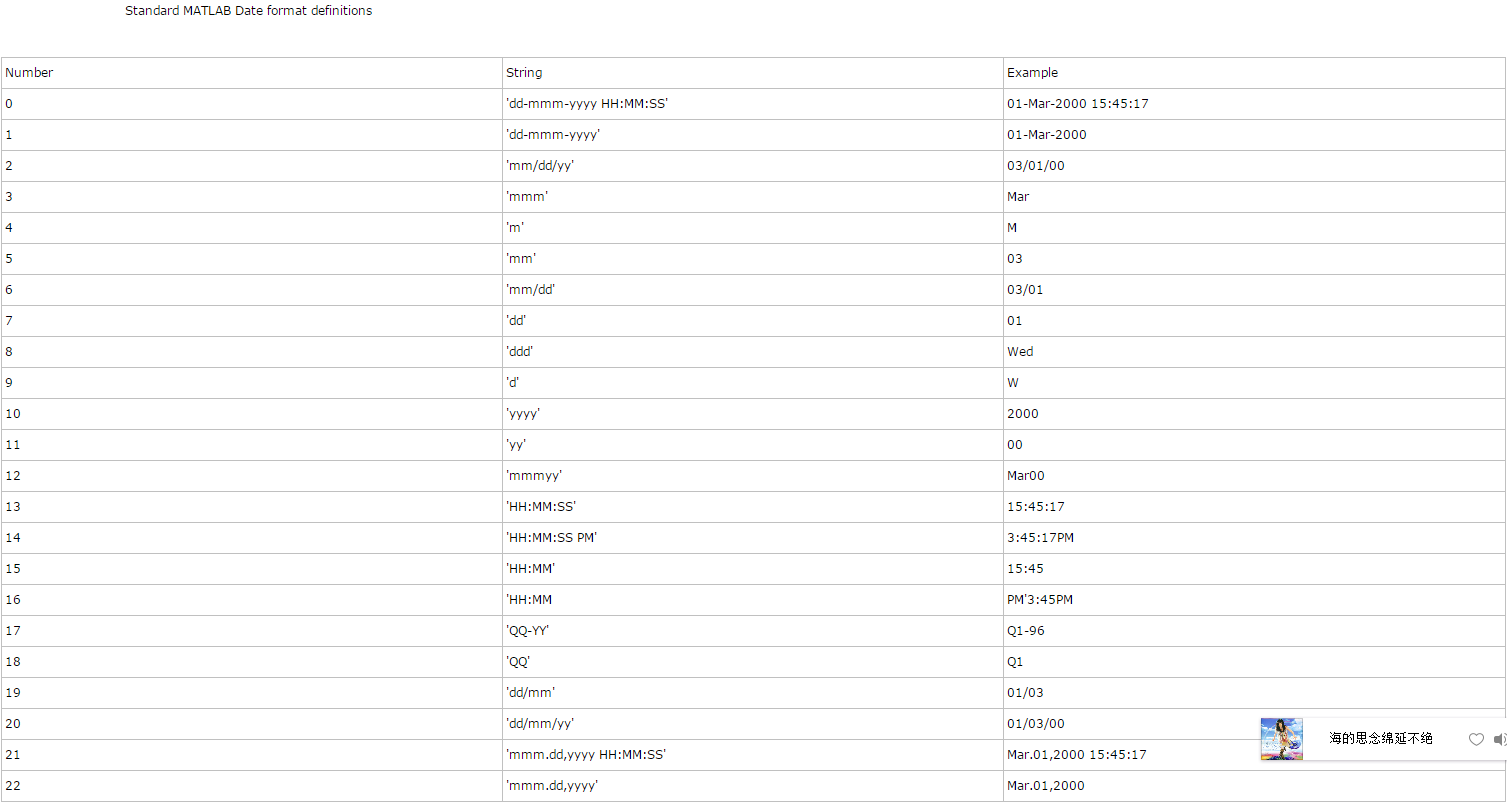
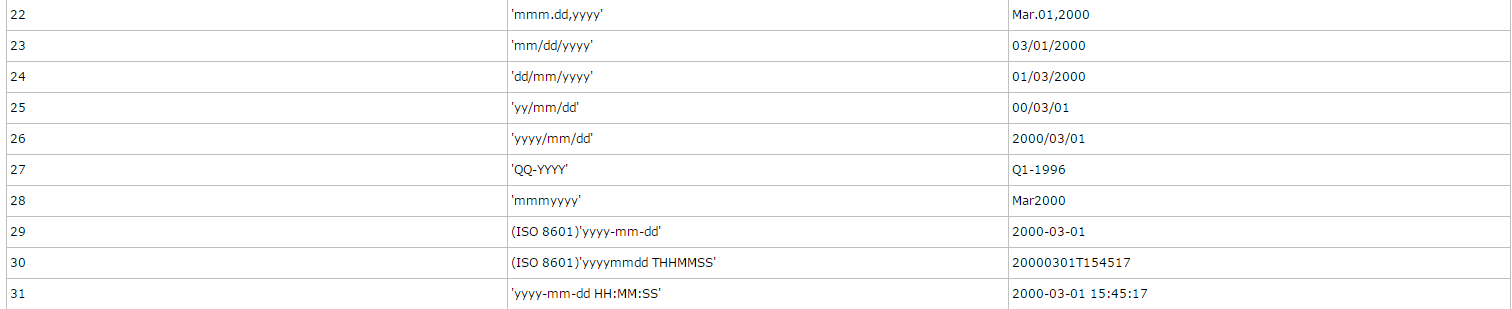
1.生成指定格式日期和时间

标准日期格式
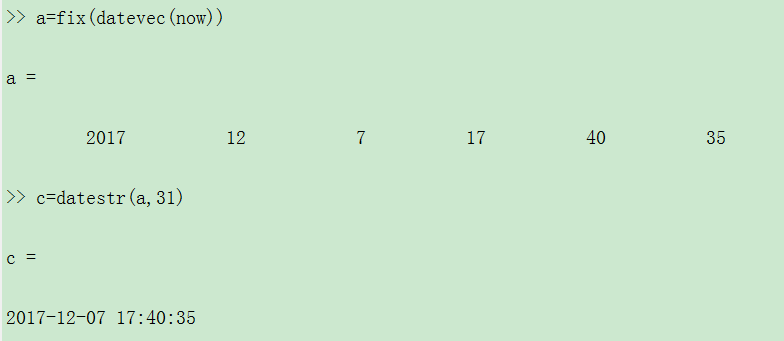
2.获取当前时间的数值
>> datestr(now,31)

ans =

2017-09-11 19:56:26
>> datestr(now,'yyyy-mm-dd HH:MM:SS')

ans =

2017-09-11 19:58:28
>> clock

ans =

   1.0e+03 *

    2.0170    0.0090    0.0110    0.0200    0.0030    0.0264

>> datestr(now,'HH:MM:SS')

ans =

20:05:07

>> format short g
>> clock

ans =

         2017            9           11           20            5        42.98

>> now=fix(clock)

now =

        2017           9          11          20           9          16
上述转化为向量形式,可以随意调用年月日时分秒
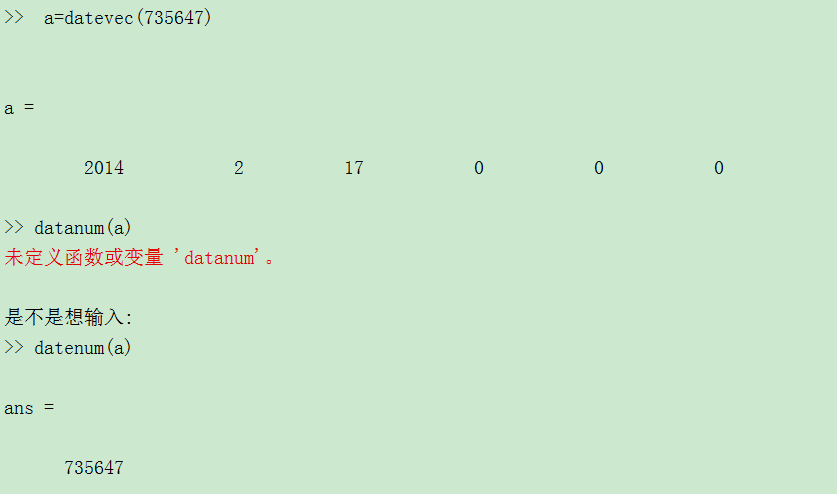
向量和天数转化
3.其他时间和日期函数或命令
>> date

ans =

11-Sep-2017
从公元0年到现在的天数
>> n=datenum(now)

n =

   7.3695e+05

>> fix(n)

ans =

      736949
>> today

ans =

      736949
clear all
DateString = '19-May-2001';
formatIn = 'dd-mmm-yyyy';
datenum(DateString,formatIn)
向量向字符串转变
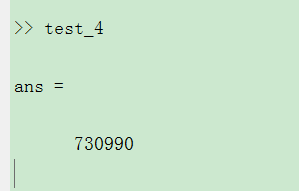
两次时间差(测试函数运行时间的函数)
>> t0=clock

t0 =

         2017            9           11           20           27        56.81

>> etime(clock,t0)

ans =

         18.8

>> t1=clock

t1 =

         2017            9           11           20           28       33.745

>> etime(t1,t0)

ans =

       36.935
利用占用CPU时间差,来进行时间差计算
>> t=cputime;
>> T=cputime-t

T =

       0.3276
tic/toc
>> tic%开始计时
>> toc%结束计时
时间已过 1.945333 秒。
星期值
>> weekday(today)

ans =

     2
>> [a,b]=weekday(today)

a =

     2


b =

Mon

>> [a,b]=weekday(today,'long')

a =

     2


b =

Monday
某月的天数
eomday(2017,9)

ans =

    30
某年的天数
>> yeardays(2017)

ans =

   365
月份表
>> calendar
                   Sep 2017
     S     M    Tu     W    Th     F     S
     0     0     0     0     0     1     2
     3     4     5     6     7     8     9
    10    11    12    13    14    15    16
    17    18    19    20    21    22    23
    24    25    26    27    28    29    30
     0     0     0     0     0     0     0
>> calendar(2017,10)
                   Oct 2017
     S     M    Tu     W    Th     F     S
     1     2     3     4     5     6     7
     8     9    10    11    12    13    14
    15    16    17    18    19    20    21
    22    23    24    25    26    27    28
    29    30    31     0     0     0     0
     0     0     0     0     0     0     0
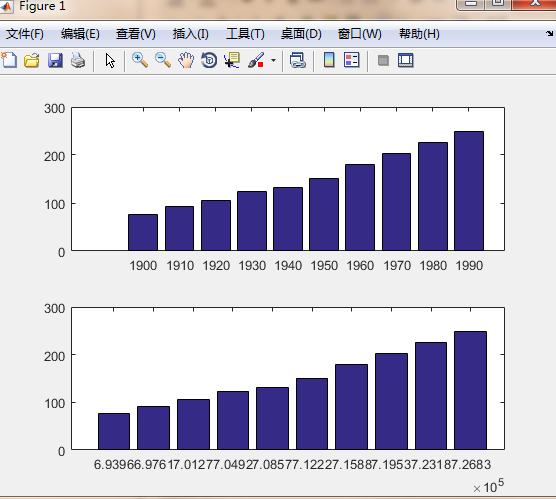
4、时间坐标转换函数 datetick函数
clear all
t = (1900:10:1990)';
p = [75.995 91.972 105.711 123.203 131.669 ...
    150.697 179.323 203.212 226.505 249.633]';
figure(1)
subplot(211),bar(t,p)
subplot(212),bar(datenum(t,1,1),p)
clear all
t = (1900:10:1990)';
p = [75.995 91.972 105.711 123.203 131.669 ...
    150.697 179.323 203.212 226.505 249.633]';
figure(1)
subplot(211),bar(t,p)
subplot(212),bar(datenum(t,1,1),p)
dateFormat = 11; %'yy'形式
datetick('x',dateFormat); %将x坐标的值换为,yy形式

figure
subplot(211),plot(n,t);
subplot(212),plot(n,t);

datetick('x','HH:MM');
grid on

