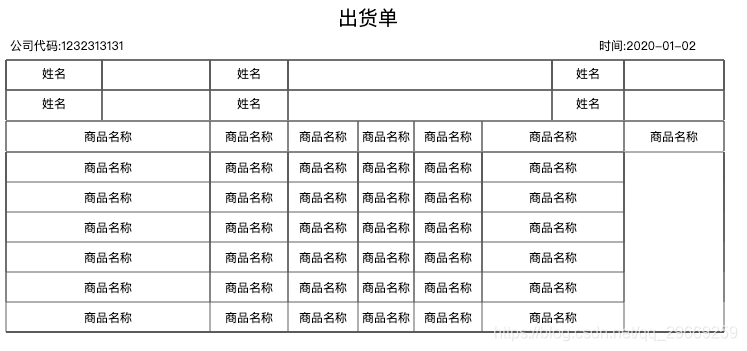
canvas绘制出货单
先上效果图 这里以a4纸为例

首先 创建一个canvas 定义宽、高
<canvas id="canvas" width="740" height="1100"></canvas>
然后 获取到canvas 获取到 绘图环境
const canvas = document.getElementById('canvas');
let ctx = canvas.getContext('2d');
画出货单上的线
for (let i = 0; i < n; i++) {
                for (let y in list) {
                    if (y !== 0) {
                        const poi = list[y] - (list[y] - list[y - 1]) / 2;
                        writeTxt(tlist[i][y - 1], '12px', [poi, startHei + txtHei + 30 * i])
                    }

                    ctx.moveTo(list[y], startHei);
                    ctx.lineTo(list[y], startHei + 30 * (i + 1));
                }

                if (isTrue) {
                    const mtY = startHei + 30 * n;

                    if (i == 0) {
                        ctx.moveTo(8, startHei + 30 * i);
                        ctx.lineTo(726, startHei + 30 * i);
                    }

                    ctx.moveTo(8, mtY);
                    ctx.lineTo(726, mtY);
                }

                ctx.moveTo(8, startHei + 30 * i);
                ctx.lineTo(lineWidth, startHei + 30 * i);


            }
这里我封装了一个函数 n 为所需要画的横线的数量 list 为每个竖线的位置数组 当不是第一个竖线的时候 绘制文字 然后画线 当绘制的为商品列表的话 算出最后一条线位置 并绘制上
好了 废话这么多 还是直接上 全部代码吧
ctx.font = `${s} bold 黑体`;
            ctx.fillStyle = c;
            ctx.textAlign = a;
            ctx.textBaseline = 'middle';
            ctx.fillText(t, p[0], p[1]);
设置文字大小 颜色 位置等 完成绘制
全部代码
<!DOCTYPE html>
<html lang="en">

<head>
    <meta charset="UTF-8">
    <meta name="viewport" content="width=device-width, initial-scale=1.0">
    <meta http-equiv="X-UA-Compatible" content="ie=edge">
    <title>Canvas</title>
</head>
<style>
    * {
        margin: 0;
        padding: 0;
    }

    html,
    body {
        width: 100%;
        height: auto;
    }
</style>

<body>
    <canvas id="canvas" width="740" height="1100"></canvas>
    <script>
        const canvas = document.getElementById('canvas');
        let ctx = canvas.getContext('2d');

        /**
         * @writeTxt: canvas 写入字内容
         * @param {str} t 所需要写入的文字
         * @param {str} s 写入文字的样式
         * @param {arr} p 写入文字的位置
         * @param {arr} a 写入文字对齐方式 默认 居中
         * @param {obj} c 写入文字颜色 默认 #000
         */
        const writeTxt = (t, s, p, a = 'center', c = '#000') => {
            if (!t) {
                return;
            }
            ctx.font = `${s} bold 黑体`;
            ctx.fillStyle = c;
            ctx.textAlign = a;
            ctx.textBaseline = 'middle';
            ctx.fillText(t, p[0], p[1]);
        }
        /**
         * @drawTable: 画表格
         */
        const drawTable = () => {
            const headArr = [8, 104, 212, 290, 554, 626, 726]
            const headTxtArr = [
                ['姓名', ' ', '姓名', ' ', '姓名', ' '],
                ['姓名', ' ', '姓名', '', '姓名', ' ']
            ]
            const titleArr = [8, 212, 290, 360, 416, 484, 626, 726];
            const titleTxtArr = [
                ['商品名称', '商品名称', '商品名称', '商品名称', '商品名称', '商品名称', '商品名称']
            ]
            const goodsTxtArr = [
                ['商品名称', '商品名称', '商品名称', '商品名称', '商品名称', '商品名称', ''],
                ['商品名称', '商品名称', '商品名称', '商品名称', '商品名称', '商品名称', ''],
                ['商品名称', '商品名称', '商品名称', '商品名称', '商品名称', '商品名称', ''],
                ['商品名称', '商品名称', '商品名称', '商品名称', '商品名称', '商品名称', ''],
                ['商品名称', '商品名称', '商品名称', '商品名称', '商品名称', '商品名称', ''],
                ['商品名称', '商品名称', '商品名称', '商品名称', '商品名称', '商品名称', '']
            ]

            drawLine(headArr, headTxtArr, 62, 726, 2)
            drawLine(titleArr, titleTxtArr, 123, 726, 1, 16)
            drawLine(titleArr, goodsTxtArr, 154, 626, goodsTxtArr.length, 16, true)
        }

        /**
         * @drawLine: 画table线
         * @param list {arr} 表格竖线x轴位置
         * @param tlist {arr} 表格需要填写文字 无文字 填 ''
         * @param startHei {num} 开始画线的高度
         * @param lineWidth {num} 横线的长度
         * @param n {num} 行数
         * @param txtHei {num} 文字位置调整
         * @param isTrue {boolean} 是否为物资列表
         */
        const drawLine = (list, tlist, startHei, lineWidth, n, txtHei = 14, isTrue = false) => {
            for (let i = 0; i < n; i++) {
                for (let y in list) {
                    if (y !== 0) {
                        const poi = list[y] - (list[y] - list[y - 1]) / 2;
                        writeTxt(tlist[i][y - 1], '12px', [poi, startHei + txtHei + 30 * i])
                    }

                    ctx.moveTo(list[y], startHei);
                    ctx.lineTo(list[y], startHei + 30 * (i + 1));
                }

                if (isTrue) {
                    const mtY = startHei + 30 * n;

                    if (i == 0) {
                        ctx.moveTo(8, startHei + 30 * i);
                        ctx.lineTo(726, startHei + 30 * i);
                    }

                    ctx.moveTo(8, mtY);
                    ctx.lineTo(726, mtY);
                }

                ctx.moveTo(8, startHei + 30 * i);
                ctx.lineTo(lineWidth, startHei + 30 * i);


            }

            if (isTrue) {
                const mtY = startHei + 30 * n;
                ctx.moveTo(8, mtY);
                ctx.lineTo(726, mtY);
            }

            ctx.strokeStyle = '#5a5a59';
            ctx.stroke();
        }

        writeTxt('出货单', '20px', [370, 20])
        writeTxt('公司代码:1232313131', '12px', [12, 48], 'left')
        writeTxt('时间:2020-01-02', '12px', [698, 48], 'right')
        drawTable()
    </script>
</body>

</html>
如有错误 请指出 谢谢!


