

Docker 安装Sentinel-dashboard/Zipkin/SpringBoot Admin/Grafana/Prometheus
一、Sentinel-dashboard
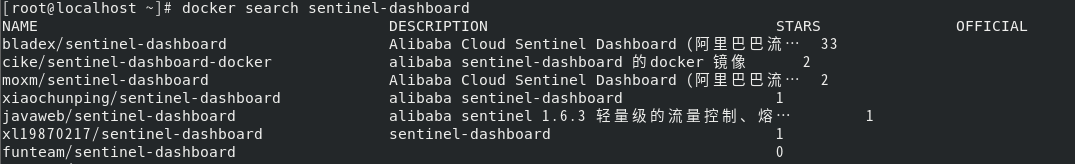
1. 搜索镜像:docker search sentinel-dashboard;
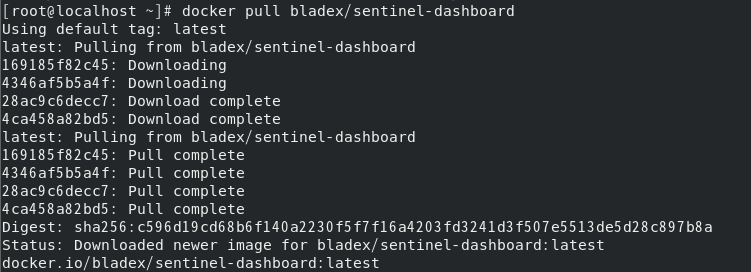
2. 拉取镜像:docker pull bladex/sentinel-dashboard:latest;
3. 查看本地镜像:docker images;

4. stack.yml部署文件;

# sentinel服务熔断控制台
sentinel-dashboard:
    image: bladex/sentinel-dashboard:latest
    ports:
        - 8858:8858
    environment:
        TZ: Asia/Shanghai
        auth.username: sentinel
        auth.password: sentinel
5. 执行stack.yml文件:docker stack deploy -c stack.yml sentinel-dashboard。
二、Zipkin
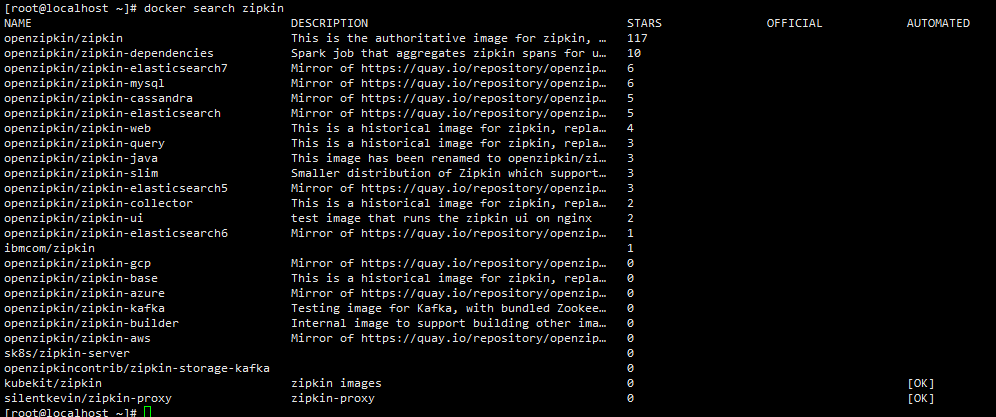
1. 搜索镜像:docker search zipkin;
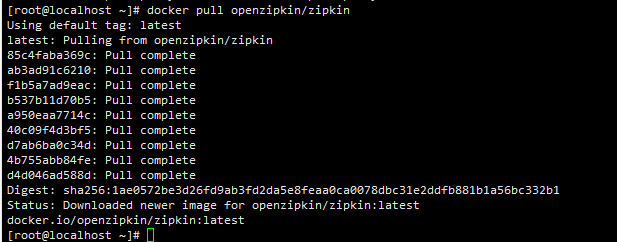
2. 拉取镜像:docker pull openzipkin/zipkin:latest;
3. 查看本地镜像:docker images;

4. stack.yml部署文件;
# zipkin链路追踪
zipkin:
    image: openzipkin/zipkin:latest
    ports:
        - 9411:9411
    depends_on:
        - mysql
    environment:
        TZ: Asia/Shanghai
        STORAGE_TYPE: mysql
        MYSQL_DB: zipkin
        MYSQL_USER: root
        MYSQL_PASS: 123456
        MYSQL_HOST: mysql
        MYSQL_TCP_PORT: 3306
5. 执行stack.yml文件:docker stack deploy -c stack.yml zipkin。
三、Spring-boot-admin
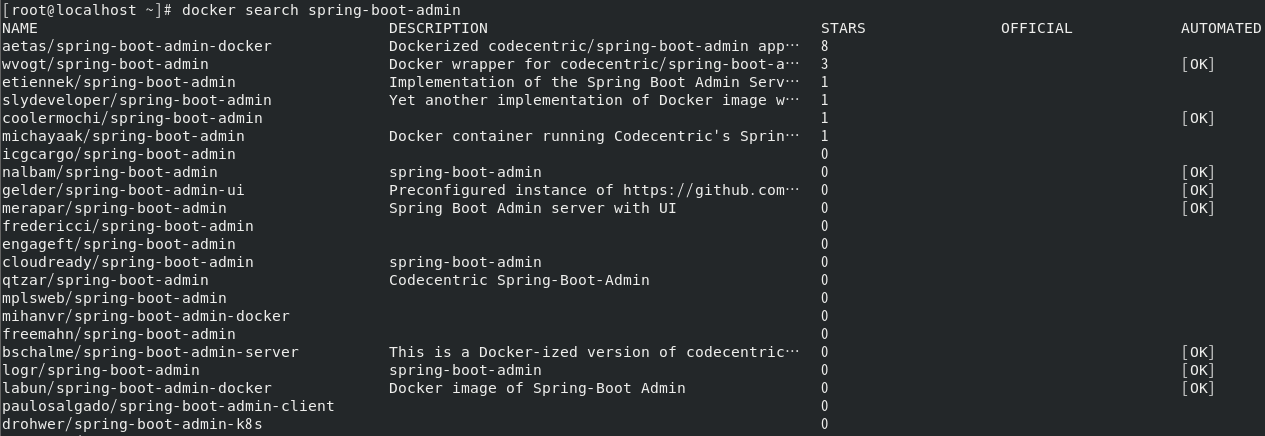
1. 搜索镜像:docker search spring-boot-admin;
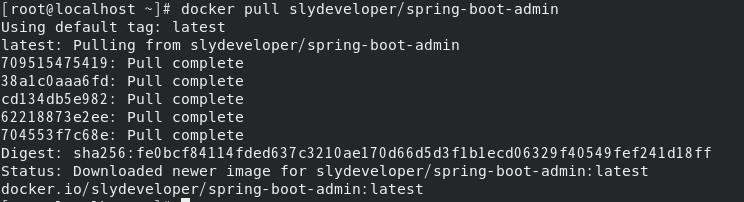
2. 拉取镜像:docker pull slydeveloper/spring-boot-admin:latest;
3. 查看本地镜像:docker images;

4. stack.yml部署文件;
# springboot admin监控
admin:
    image: slydeveloper/spring-boot-admin:latest
    ports:
        - 8090:1111
    volumes:
        - /admin/application.properties:/opt/spring-boot-admin-docker/application-docker.properties
    environment:
        TZ: Asia/Shanghai
    healthcheck:
        test: "curl -sS http://localhost:1111/health"
        interval: 1s
        timeout: 60s
        retries: 120
5. 执行stack.yml文件:docker stack deploy -c stack.yml admin。
四、Grafana
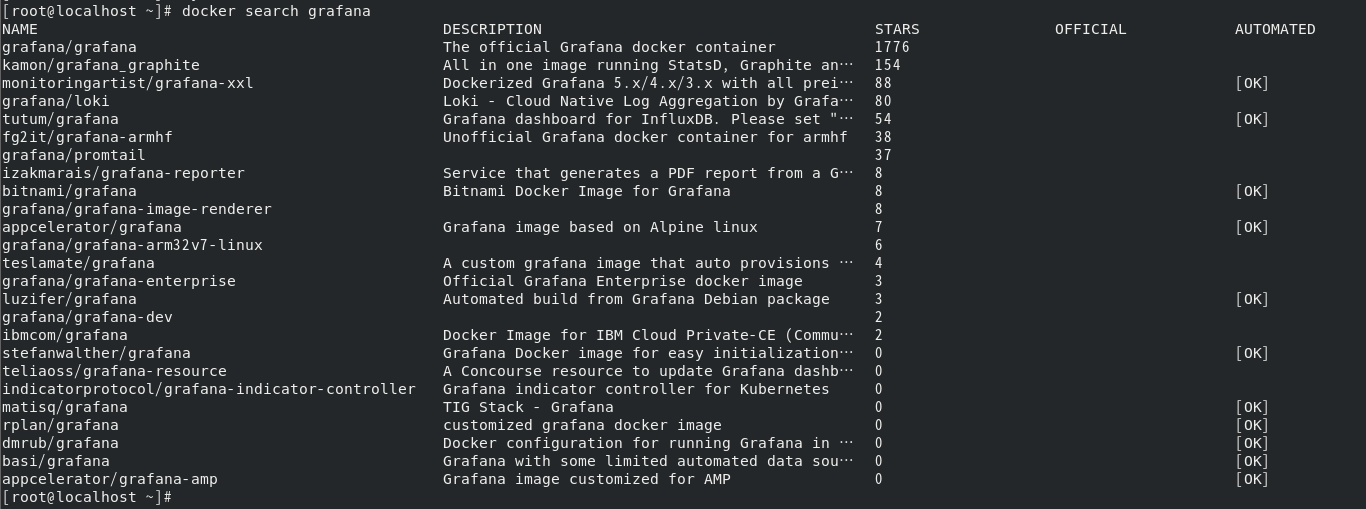
1. 搜索镜像:docker search grafana;
2. 拉取镜像:docker pull grafana/grafana:latest;

3. 查看本地镜像:docker images;

4. stack.yml部署文件;
# Grafana 监控
    grafana:
        image: grafana/grafana:latest
        ports:
            - 3000:3000
        volumes:
            - /grafana/data:/var/lib/grafana
        environment:
            TZ: Asia/Shanghai
5. 执行stack.yml文件:docker stack deploy -c stack.yml grafana;
6. 访问界面:默认账号密码都为admin。
五、Prometheus
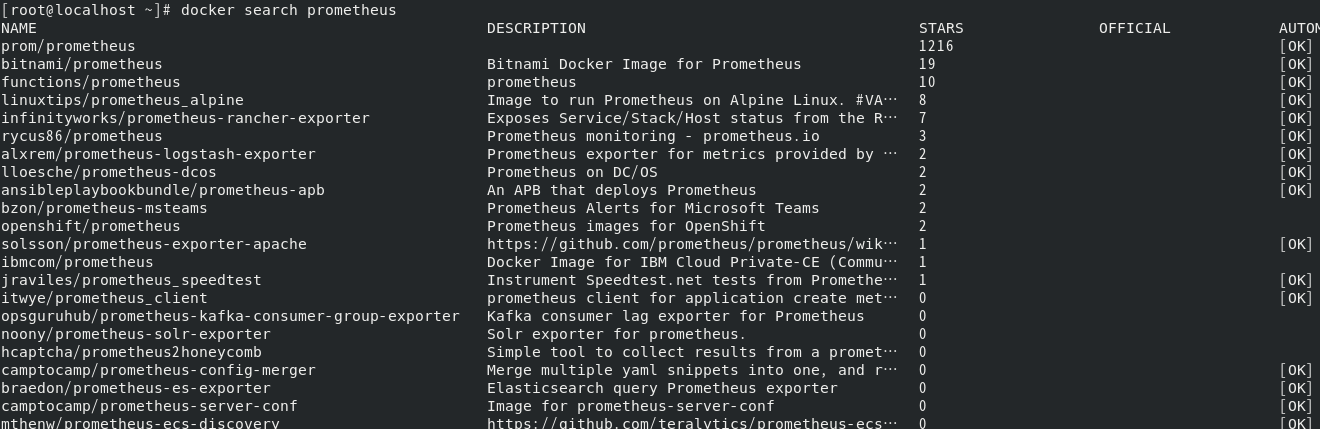
1. 搜索镜像:docker search prometheus;
2. 拉取镜像:docker pull prom/prometheus:latest;
3. 查看本地镜像:docker images;

4. stack.yml部署文件;
    # Prometheus 监控
    prometheus:
        image: prom/prometheus:latest
        ports:
            - 9090:9090
        volumes:
            - /data/prometheus/prometheus.yml:/etc/prometheus/prometheus.yml
        environment:
            TZ: Asia/Shanghai
5. 执行stack.yml文件:docker stack deploy -c stack.yml prometheus。


【推荐】国内首个AI IDE,深度理解中文开发场景,立即下载体验Trae
【推荐】编程新体验,更懂你的AI,立即体验豆包MarsCode编程助手
【推荐】抖音旗下AI助手豆包,你的智能百科全书,全免费不限次数
【推荐】轻量又高性能的 SSH 工具 IShell:AI 加持,快人一步
· AI与.NET技术实操系列:基于图像分类模型对图像进行分类
· go语言实现终端里的倒计时
· 如何编写易于单元测试的代码
· 10年+ .NET Coder 心语,封装的思维:从隐藏、稳定开始理解其本质意义
· .NET Core 中如何实现缓存的预热?
· 25岁的心里话
· 闲置电脑爆改个人服务器(超详细) #公网映射 #Vmware虚拟网络编辑器
· 零经验选手,Compose 一天开发一款小游戏!
· 通过 API 将Deepseek响应流式内容输出到前端
· AI Agent开发,如何调用三方的API Function,是通过提示词来发起调用的吗