matplotlib学习 2
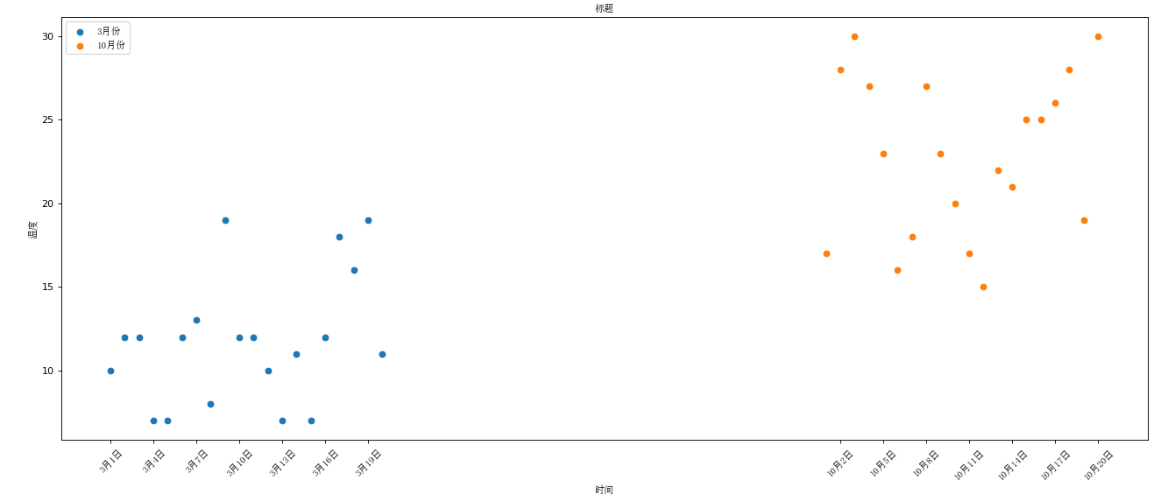
绘制散点图
from matplotlib import pyplot as plt
from matplotlib import font_manager
import random

#设置字体
my_font = font_manager.FontProperties(fname=r"C:\Windows\Fonts\SimSun.ttc")

#生成数据(导入数据)
y_3 = [random.randint(5,20) for i in range(20)]
y_10 = [random.randint(15,30) for i in range(20)]
x_3 = range(1,21)
x_10 = range(51,71)

# 设置大小
plt.figure(figsize=(20,8),dpi=80)

#绘制散点图
plt.scatter(x_3,y_3,label="3月份")
plt.scatter(x_10,y_10,label="10月份") # label是legend的图例上显示的

#调整x轴的刻度
_x = list(x_3) + list(x_10)
_xtick_labels = ["3月{}日".format(i) for i in x_3]
_xtick_labels += ["10月{}日".format(i-50) for i in x_10]
plt.xticks(_x[::3],_xtick_labels[::3],fontproperties=my_font,rotation=45)

#添加图例
plt.legend(loc="upper left",prop=my_font)

#添加描述信息
plt.xlabel("时间",fontproperties=my_font)
plt.ylabel("温度",fontproperties=my_font)
plt.title("标题",fontproperties=my_font)

plt.show()
多次绘制
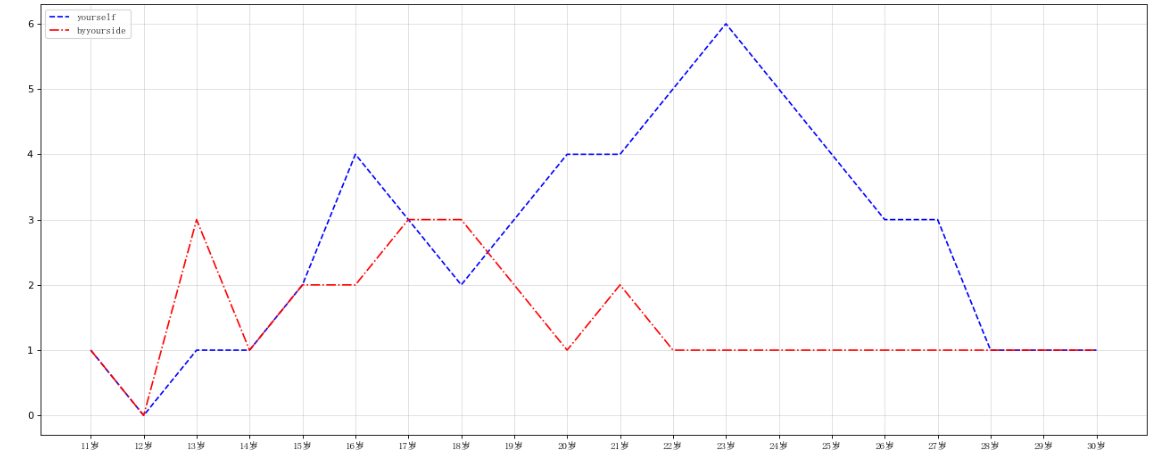
同一张图绘制两条折线
from matplotlib import pyplot as plt
from matplotlib import font_manager
import random

#设置字体
my_font = font_manager.FontProperties(fname=r"C:\Windows\Fonts\SimSun.ttc")

y_1 = [1,0,1,1,2,4,3,2,3,4,4,5,6,5,4,3,3,1,1,1]
y_2=  [1,0,3,1,2,2,3,3,2,1,2,1,1,1,1,1,1,1,1,1]
x = range(11,31)
plt.figure(figsize=(20,8),dpi=80)

#传入两条折线,同时设置颜色和style
plt.plot(x,y_1,label="yourself",color='blue',linestyle='--')
plt.plot(x,y_2,label="byyourside",color='red',linestyle='-.')

_xtick_labels = ["{}岁".format(i) for i in x]
plt.xticks(x,_xtick_labels,fontproperties=my_font)

#绘制网格
plt.grid(alpha=0.4)#alpha透明度

#添加图例
plt.legend(prop=my_font,loc="upper left")

plt.show()
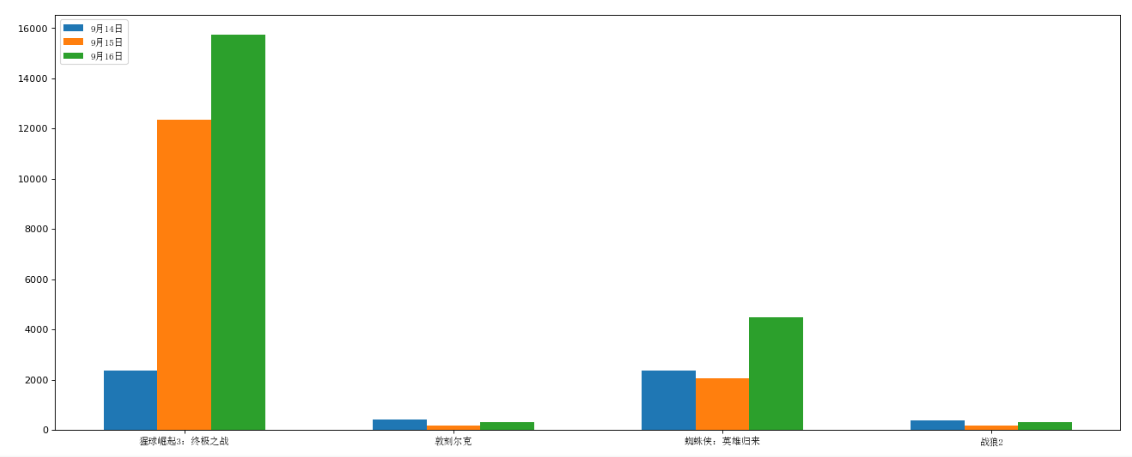
绘制条形图
from matplotlib import pyplot as plt
from matplotlib import font_manager
import random

#设置字体
my_font = font_manager.FontProperties(fname=r"C:\Windows\Fonts\SimSun.ttc")

#数据
a = ["猩球崛起3:终极之战","敦刻尔克","蜘蛛侠:英雄归来","战狼2"]
b_16 = [15746,312,4497,319]
b_15 = [12357,156,2045,168]
b_14 = [2358,399,2358,362]

bar_width = 0.2 # 每个条的宽度

x_14 = list(range(len(a)))
x_15 = [i+0.2 for i in x_14]
x_16 = [i+0.4 for i in x_14]

plt.figure(figsize=(20,8),dpi=80)

plt.bar(range(len(a)),b_14,width=bar_width,label="9月14日")
plt.bar(x_15,b_15,width=bar_width,label="9月15日")
plt.bar(x_16,b_16,width=bar_width,label="9月16日")

plt.legend(prop=my_font,loc="upper left")

#设置x轴的刻度
plt.xticks(x_15,a,fontproperties=my_font)
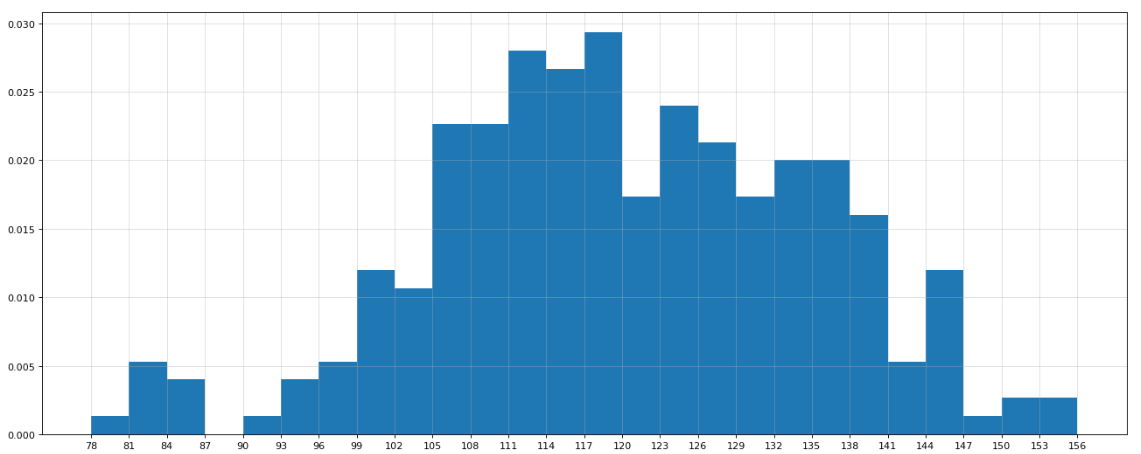
绘制直方图
from matplotlib import pyplot as plt
from matplotlib import font_manager
import random

#设置字体
my_font = font_manager.FontProperties(fname=r"C:\Windows\Fonts\SimSun.ttc")
a=[131,  98, 125, 131, 124, 139, 131, 117, 128, 108, 135, 138, 131, 102, 107, 114, 119, 128, 121, 142, 127, 130, 124, 101, 110, 116, 117, 110, 128, 128, 115,  99, 136, 126, 134,  95, 138, 117, 111,78, 132, 124, 113, 150, 110, 117,  86,  95, 144, 105, 126, 130,126, 130, 126, 116, 123, 106, 112, 138, 123,  86, 101,  99, 136,123, 117, 119, 105, 137, 123, 128, 125, 104, 109, 134, 125, 127,105, 120, 107, 129, 116, 108, 132, 103, 136, 118, 102, 120, 114,105, 115, 132, 145, 119, 121, 112, 139, 125, 138, 109, 132, 134,156, 106, 117, 127, 144, 139, 139, 119, 140,  83, 110, 102,123,107, 143, 115, 136, 118, 139, 123, 112, 118, 125, 109, 119, 133,112, 114, 122, 109, 106, 123, 116, 131, 127, 115, 118, 112, 135,115, 146, 137, 116, 103, 144,  83, 123, 111, 110, 111, 100, 154,136, 100, 118, 119, 133, 134, 106, 129, 126, 110, 111, 109, 141,120, 117, 106, 149, 122, 122, 110, 118, 127, 121, 114, 125, 126,114, 140, 103, 130, 141, 117, 106, 114, 121, 114, 133, 137,  92,121, 112, 146,  97, 137, 105,  98, 117, 112,  81,  97, 139, 113,134, 106, 144, 110, 137, 137, 111, 104, 117, 100, 111, 101, 110,105, 129, 137, 112, 120, 113, 133, 112,  83,  94, 146, 133, 101,131, 116, 111,  84, 137, 115, 122, 106, 144, 109, 123, 116, 111,111, 133, 150]

#计算组数
d = 3 # 组距
num_bins = (max(a)-min(a))//d

plt.figure(figsize=(20,8),dpi=80)
plt.grid(alpha=0.4)
#density True为概率分布直方图,False为数量分布直方图
plt.hist(a,num_bins,density=True) # normed用不了了,现在得用density

#设置x轴刻度
plt.xticks(range(min(a),max(a)+d,d))
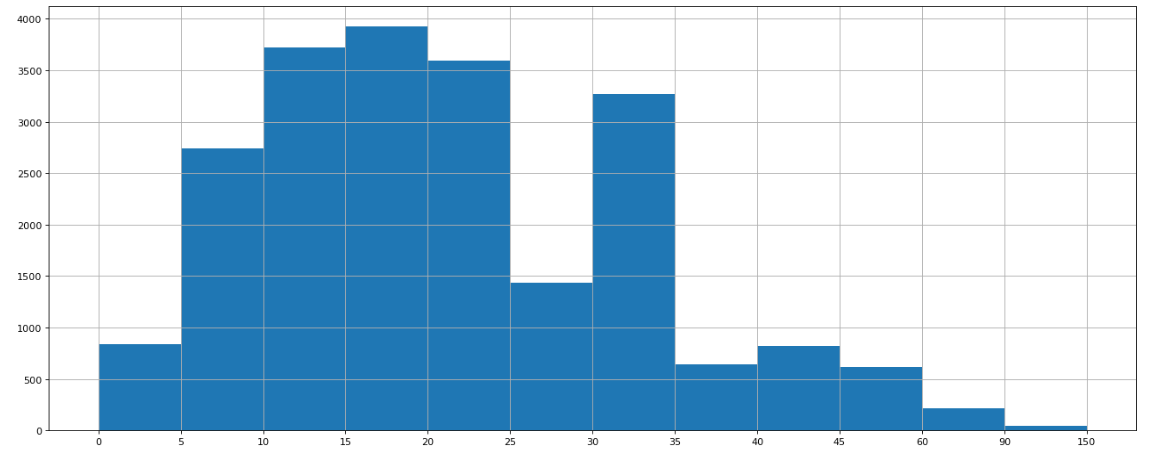
from matplotlib import pyplot as plt
from matplotlib import font_manager
import random
#设置字体
my_font = font_manager.FontProperties(fname=r"C:\Windows\Fonts\SimSun.ttc")

interval = [0,5,10,15,20,25,30,35,40,45,60,90]
width = [1,1,1,1,1,1,1,1,1,3,6,12] # 下面xtick是按照width=1生成的,所以这个width没有用上
quantity = [836,2737,3723,3926,3596,1438,3273,642,824,613,215,47]

plt.figure(figsize=(20,8),dpi=80)

plt.bar(range(12),quantity,width=1)
_x = [i-0.5 for i in range(13)]
_xtick_labels = interval + [150]
plt.xticks(_x,_xtick_labels)
plt.grid()