

a list of frequently asked questions about Circus
How does Circus stack compare to a classical stack?
In a classical WSGI stack, you have a server like Gunicorn that serves on a port or an unix socket and is usually deployed behind a web server like Nginx:
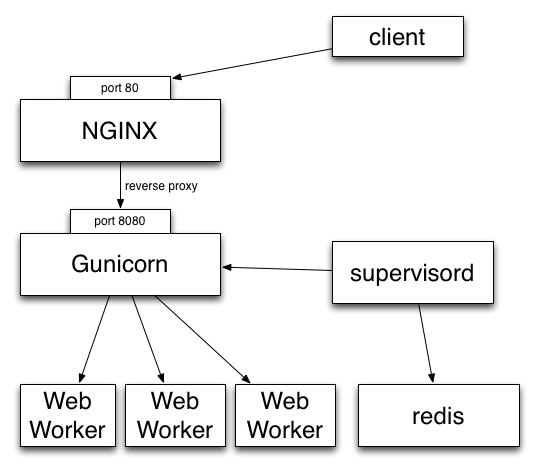
Clients call Nginx, which reverse proxies all the calls to Gunicorn.
If you want to make sure the Gunicorn process stays up and running, you have to use a program like Supervisord or upstart.
Gunicorn in turn watches for its processes (“workers”).
In other words you are using two levels of process managment. One that you manage and control (supervisord), and a second one that you have to manage in a different UI, with a different philosophy and less control over what’s going on (the wsgi server’s one)
This is true for Gunicorn and most multi-processes WSGI servers out there I know about. uWsgi is a bit different as it offers plethoras of options.
But if you want to add a Redis server in your stack, you will end up with managing your stack processes in two different places.
Circus’ approach on this is to manage processes and sockets.
A Circus stack can look like this:
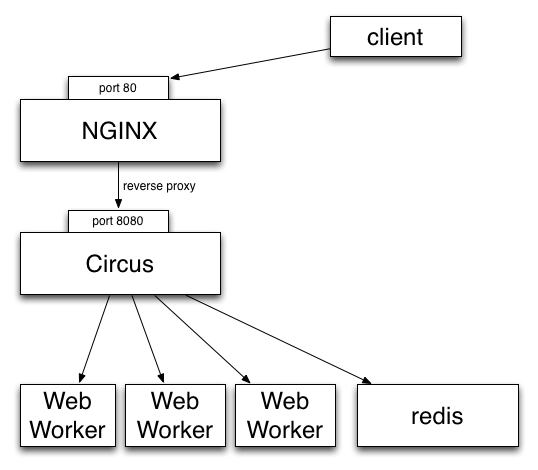
So, like Gunicorn, Circus is able to bind a socket that will be proxied by Nginx. Circus doesn’t deal with the requests but simply binds the socket. It’s then up to a web worker process to accept connections on the socket and do the work.
It provides equivalent features than Supervisord but will also let you manage all processes at the same level, whether they are web workers or Redis or whatever. Adding a new web worker is done exactly like adding a new Redis process.
Benches
We did a few benches to compare Circus & Chaussette with Gunicorn. To summarize, Circus is not adding any overhead and you can pick up many different backends for your web workers.
See:
How to troubleshoot Circus?
By default, circusd keeps its logging to stdout rather sparse. This lack of output can make things hard to troubleshoot when processes seem to be having trouble starting.
To increase the logging circusd provides, try increasing the log level. To see the available log levels just use the –helpflag.
$ circus --log-level debug test.ini
One word of warning. If a process is flapping and the debug log level is turned on, you will see messages for each start attempt. It might be helpful to configure the app that is flapping to use a warmup_delay to slow down the messages to a manageable pace.
[watcher:webapp]
cmd = python -m myapp.wsgi
warmup_delay = 5
By default, stdout and stderr are captured by the circusd process. If you are testing your config and want to see the output in line with the circusd output, you can configure your watcher to use the StdoutStream class.
[watcher:webapp]
cmd = python -m myapp.wsgi
stdout_stream.class = StdoutStream
stderr_stream.class = StdoutStream
If your application is producing a traceback or error when it is trying to start up you should be able to see it in the output.


【推荐】国内首个AI IDE,深度理解中文开发场景,立即下载体验Trae
【推荐】编程新体验,更懂你的AI,立即体验豆包MarsCode编程助手
【推荐】抖音旗下AI助手豆包,你的智能百科全书,全免费不限次数
【推荐】轻量又高性能的 SSH 工具 IShell:AI 加持,快人一步
· 记一次.NET内存居高不下排查解决与启示
· 探究高空视频全景AR技术的实现原理
· 理解Rust引用及其生命周期标识(上)
· 浏览器原生「磁吸」效果!Anchor Positioning 锚点定位神器解析
· 没有源码,如何修改代码逻辑?
· 全程不用写代码,我用AI程序员写了一个飞机大战
· DeepSeek 开源周回顾「GitHub 热点速览」
· 记一次.NET内存居高不下排查解决与启示
· MongoDB 8.0这个新功能碉堡了,比商业数据库还牛
· .NET10 - 预览版1新功能体验(一)
2017-06-10 一款直接时空处理分析的开源数据库---geomesa
2017-06-10 nginx php 配置
2017-06-10 Apache Accumulo
2017-06-10 Kubernetes Helm
2017-06-10 Helm Charts