

一下这三个div大小不一样 为了保证每次柱状图渲染正确 添加key
<div class="echart1" id="dangerChart1" key="1"></div>
<div class="echart2" id="dangerChart2" key="2"></div>
<div class="echart3" id="dangerChart3" key="3"></div>
changeTab(index) {
this.activeIndex = index;
this.$nextTick(() => {
// 个div加key 或者 清楚instance都可以让div重绘
// if (document.getElementById(`dangerChart${index}`).getAttribute('_echarts_instance_')) {
// document.getElementById(`dangerChart${index}`).removeAttribute('_echarts_instance_');
// }
this.initEchart(index);
});
},
createEchartsInstance(elId) {
let el = document.getElementById(elId);
let chart = echarts.getInstanceByDom(el); //获取实例,不要重复初始化
if (!chart) {
chart = echarts.init(el);
//$once钩子的好处:
//1每个新的实例都程序化地在后期清理它自己
//2减少dom查询
this.$once('hook:beforeDestroy', () => {
chart.clear();
echarts.dispose(chart);
});
}
return chart;
},
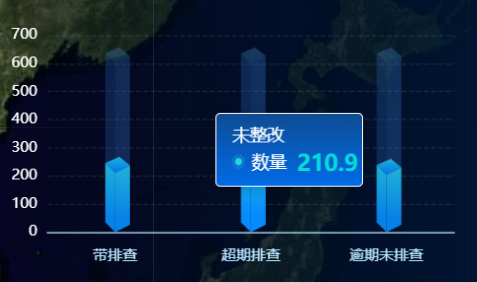
initEchart(index) { this.myChart = this.createEchartsInstance(`dangerChart${index}`); // var myChart = echarts.init(chartDom); this.myChart.clear(); let option; // 绘制左侧面 const CubeLeft = echarts.graphic.extendShape({ shape: { x: 0, y: 0 }, buildPath: function (ctx, shape) { // 会canvas的应该都能看得懂,shape是从custom传入的 const xAxisPoint = shape.xAxisPoint; const c0 = [shape.x, shape.y]; const c1 = [shape.x - 8, shape.y - 8]; const c2 = [xAxisPoint[0] - 8, xAxisPoint[1] - 8]; const c3 = [xAxisPoint[0], xAxisPoint[1]]; ctx.moveTo(c0[0], c0[1]).lineTo(c1[0], c1[1]).lineTo(c2[0], c2[1]).lineTo(c3[0], c3[1]).closePath(); } }); // 绘制右侧面 const CubeRight = echarts.graphic.extendShape({ shape: { x: 0, y: 0 }, buildPath: function (ctx, shape) { const xAxisPoint = shape.xAxisPoint; const c1 = [shape.x, shape.y]; const c2 = [xAxisPoint[0], xAxisPoint[1]]; const c3 = [xAxisPoint[0] + 12, xAxisPoint[1] - 6]; const c4 = [shape.x + 12, shape.y - 6]; ctx.moveTo(c1[0], c1[1]).lineTo(c2[0], c2[1]).lineTo(c3[0], c3[1]).lineTo(c4[0], c4[1]).closePath(); } }); // 绘制顶面 const CubeTop = echarts.graphic.extendShape({ shape: { x: 0, y: 0 }, buildPath: function (ctx, shape) { const c1 = [shape.x, shape.y]; const c2 = [shape.x + 12, shape.y - 6]; const c3 = [shape.x + 3.5, shape.y - 13]; const c4 = [shape.x - 8, shape.y - 8]; ctx.moveTo(c1[0], c1[1]).lineTo(c2[0], c2[1]).lineTo(c3[0], c3[1]).lineTo(c4[0], c4[1]).closePath(); } }); // 注册三个面图形 echarts.graphic.registerShape('CubeLeft', CubeLeft); echarts.graphic.registerShape('CubeRight', CubeRight); echarts.graphic.registerShape('CubeTop', CubeTop); const MAX = [600, 600, 600, 600, 600, 600, 600]; const VALUE = [210.9, 260.8, 204.2, 504.9, 440.5, 400.3, 119.0]; option = { backgroundColor: 'transparent', tooltip: { trigger: 'axis', axisPointer: { type: 'none' }, className: 'chartClass', // eslint-disable-next-line no-unused-vars formatter: function (params, ticket, callback) { const item = params[1]; return `<div class="text">未整改 </div> <div class="fixCount"> <div class="circle"></div> <div class="count">数量</div> <div class="num">${item.value}</div> </div>`; } }, grid: { left: 10, right: 10, bottom: 10, top: 10, containLabel: true }, xAxis: { type: 'category', data: ['带排查', '超期排查', '逾期未排查'], axisLine: { show: true, lineStyle: { color: '#BAE7FF' } }, offset: 6, axisTick: { show: false, length: 9, alignWithLabel: true, lineStyle: { color: '#7DFFFD' } }, axisLabel: { show: true, fontSize: 12 } }, yAxis: { // min: 0, // max: 600, // interval: 200, type: 'value', axisLine: { show: false, lineStyle: { color: 'white' } }, splitLine: { show: true, lineStyle: { type: 'dashed', color: 'rgba(255,255,255,0.1)' } }, axisTick: { show: false }, axisLabel: { show: true, fontSize: 12 }, boundaryGap: ['20%', '20%'] }, series: [ { type: 'custom', renderItem: function (params, api) { const location = api.coord([api.value(0), api.value(1)]); return { type: 'group', children: [ { type: 'CubeLeft', shape: { api, x: location[0], y: location[1], xAxisPoint: api.coord([api.value(0), 0]) }, style: { fill: 'rgba(47,102,192,.27)' } }, { type: 'CubeRight', shape: { api, x: location[0], y: location[1], xAxisPoint: api.coord([api.value(0), 0]) }, style: { fill: 'rgba(59,128,226,.27)' } }, { type: 'CubeTop', shape: { api, x: location[0], y: location[1], xAxisPoint: api.coord([api.value(0), 0]) }, style: { fill: 'rgba(72,156,221,.27)' } } ] }; }, data: MAX }, { type: 'custom', renderItem: (params, api) => { const location = api.coord([api.value(0), api.value(1)]); var color = api.value(1) > 600 ? 'red' : new echarts.graphic.LinearGradient(0, 0, 0, 1, [ { offset: 0, color: '#20B0D6' }, { offset: 0.8, color: '#0681E7' } ]); return { type: 'group', children: [ { type: 'CubeLeft', shape: { api, xValue: api.value(0), yValue: api.value(1), x: location[0], y: location[1], xAxisPoint: api.coord([api.value(0), 0]) }, style: { fill: color } }, { type: 'CubeRight', shape: { api, xValue: api.value(0), yValue: api.value(1), x: location[0], y: location[1], xAxisPoint: api.coord([api.value(0), 0]) }, style: { fill: color } }, { type: 'CubeTop', shape: { api, xValue: api.value(0), yValue: api.value(1), x: location[0], y: location[1], xAxisPoint: api.coord([api.value(0), 0]) }, style: { fill: color } } ] }; }, data: VALUE }, { type: 'bar', label: { normal: { show: false, position: 'top', fontSize: 12, color: '#fff', offset: [2, -20] } }, itemStyle: { color: 'transparent' }, tooltip: {}, data: MAX } ] }; option && this.myChart.setOption(option, true); }
