

Python网络爬虫——爬取和分析福建二手房房价及各项数据
一、 选题的背景介绍
随着越来越多城市的房地产市场进入存量时代,二手房市场的地位愈发重要,其走势对于房地产整体市场的影响也逐渐加强。在很多二手房市场规模占比较高的一二线城市,二手房市场与新房市场通过“卖旧买新”的链条形成较强的联动:二手房卖家通过置换现有住房获得资金,转而在新房市场实现住房改善。
在买房之前,人们会在相关网站上搜索自己想要了解的住房信息,但是面对庞大且来源广泛的网络数 据,如何缩短网页下载时间,如何分析大量数据并找出有用信息,就需要用到网络爬虫技术。本文通过 Python爬虫程序爬取链家网上福建省份的二手房数据,爬取的字段包括所在区域、户型结构、装修情况、总价、单价等,并对采集到的这些数据进行清洗。最后对清洗过的数据用echarts进行可视化分析,探索福建二手房建筑面积、位置、户型等对二手房房价的影响情况。
二、 数据可视化分析的步骤
1. 爬虫名称:爬取链家网站二手房数据
2. 爬取内容:爬取房子名称、价格、平方价格、面积、所在城市、所在地区、户型等
3. 方案描述:观察链家网站二手房的访问地址,找到规律,进行地址拼接,再爬取每个页面的房子详情页的地址,循环解析提取房子详情页里的信息,存储到数据库中,方便接下来的数据分析和数据可视化的展示。
技术难点:
1.在爬取过程中除了目标数据以外还存在广告等其他数据,需要做异常处理
2.使用pandas将数据库里的数据进行处理和分析
三、 主题页面的结构特征分析
1.主题页面的结构特征分析
我们要爬取的是链家网福建省内所有城市的二手房数据,链家支持的福建城市有福州、厦门、泉州、漳州,每个城市里面有100页数据,每一页里有30条房屋信息,我们需要将这三十条房屋信息的地址爬取出来逐一进行数据提取。所以爬虫的结构有三层,第一层是城市循环,第二层是页面循环,第三层是该页面的房屋信息循环。
2.节点(标签)查找方法与遍历方法

 1 name = html.xpath("//h1/text()")
 2    price = html.xpath("//span[@class='total']/text()")
 3    area = html.xpath("//div[@class='area']/div[1]/text()")
 4    priceAvg = html.xpath("//span[@class='unitPriceValue']/text()")
 5    houseType= html.xpath("//div[@class='room']/div[@class='mainInfo']/text()")
 6    orientation = html.xpath("//div[@class='type']/div[@class='mainInfo']/text()")
 7    city = html.xpath("//div[4]/div/div/a[1]/text()")
 8    district= html.xpath("//div[@class='areaName']/span[@class='info']/a[1]/text()")
 9    community = html.xpath("//div[@class='communityName']//a[1]/text()")
10    decoration=html.xpath("//div[@class='base']/div[@class='content']/ul/li[9]/text()")
11    propertyRight= html.xpath("//div[@class='transaction']/div[@class='content']/ul/li[6]/span[2]/text()")
12    lift = html.xpath("//div[@class='base']/div[@class='content']/ul/li[11]/text()")
13    lifeRate= html.xpath("//div[@class='base']/div[@class='content']/ul/li[10]/text()")
14    builtType = html.xpath("//div[@class='base']/div[@class='content']/ul/li[6]/text()")
15  builtStructure= tml.xpath("//div[@class='base']/div[@class='content']/ul/li[8]/text()")
四、 网络爬虫设计程序设计
1. 数据的爬取与采集
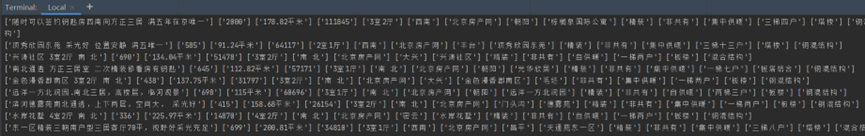
 1 def start():
 2     # 爬取所需城市的名称缩写,用于地址拼接,链家网站福建省内支持的城市仅有以下四个、支持的城市列表可以查看https://map.lianjia.com/map/350200/ESF/
 3     cityList = ['xm', 'fz', 'quanzhou', 'zhangzhou']
 4     # 设置请求头,以防被网站识别为爬虫
 5     headers = {
 6         "Upgrade-Insecure-Requests": "1",
 7         "User-Agent": "Mozilla/5.0 (Windows NT 10.0; Win64; x64) AppleWebKit/537.36 (KHTML, like Gecko) Chrome/108.0.0.0 Safari/537.36 Edg/108.0.1462.46",
 8         "Cookie": "lianjia_uuid=60c54ae6-6b42-4222-8692-efe4fb2c554e; crosSdkDT2019DeviceId=eu2b5l-mfq32x-njycw4jyhevekso-ud4cezlw8; _smt_uid=632e762f.20c8106d; _ga=GA1.2.203719967.1663989297; Hm_lvt_9152f8221cb6243a53c83b956842be8a=1669339641; lianjia_ssid=917d080d-af96-4114-92ce-e9ec6ded0cde; _gid=GA1.2.1343492366.1671084252; lianjia_token=2.0111ad29317b6152f82536df72a8e72e0777cf78c4; beikeBaseData=%7B%22parentSceneId%22:%226413099907731748097%22%7D; sensorsdata2015jssdkcross=%7B%22distinct_id%22%3A%221836d7da82957c-0d0e66116b0617-78565473-1327104-1836d7da82a940%22%2C%22%24device_id%22%3A%221836d7da82957c-0d0e66116b0617-78565473-1327104-1836d7da82a940%22%2C%22props%22%3A%7B%22%24latest_traffic_source_type%22%3A%22%E7%9B%B4%E6%8E%A5%E6%B5%81%E9%87%8F%22%2C%22%24latest_referrer%22%3A%22%22%2C%22%24latest_referrer_host%22%3A%22%22%2C%22%24latest_search_keyword%22%3A%22%E6%9C%AA%E5%8F%96%E5%88%B0%E5%80%BC_%E7%9B%B4%E6%8E%A5%E6%89%93%E5%BC%80%22%7D%7D; Hm_lpvt_9152f8221cb6243a53c83b956842be8a=1671089180; select_city=350200"
 9     }
10     # 写入csv文件,只是备份一份数据,后面并无用到
11     with open(r'二手房房价2.csv', 'a', encoding='utf_8_sig', newline='')as f:
12         table_label = ['房屋名称', '房屋总价', '建筑面积', '每平方价格', '房屋户型', '房屋朝向',
13                        '城市', '地区', '小区名称', '装修情况', '房屋产权', '电梯情况', '梯户比例', '建筑类型', '建筑结构']
14         wt = csv.writer(f)
15         wt.writerow(table_label)
16     # 按城市列表里的值进行第一轮地址拼接
17     for i in cityList:
18         url = 'https://' + i + '.lianjia.com/ershoufang/'
19         # 第二轮城市地址拼接
20         all_url = Get_url(url)
21         # 将所有url地址和请求头传入方法内进行采集
22         Get_house_url(all_url, headers)
23 # 每个城市有100页的地址,将拼接后的数据装入列表后返回
24 def Get_url(url):
25     all_url = []
26     for i in range(1, 101):
27         all_url.append(url + 'pg' + str(i) + '/')
28     return all_url
29
30
31 # 获取每一个页面里面每一套房的url
32 def Get_house_url(all_url, headers):
33     num = 0
34     # 简单统计页数
35     for i in all_url:
36         # 获取当前页面的代码
37         r = requests.get(i, headers=headers)
38         html = etree.HTML(r.text)
39         # 使用xpath匹配该页面每套房子的url,将会以列表形式存储
40         url_ls = html.xpath("//ul[@class ='sellListContent']/li/a/@href")
41         # 爬取房子详情页的内容
42         Analysis_html(url_ls, headers)
43         time.sleep(4)
44         num += 1
45         print("第%d页爬完了" % num)  # num记录爬取索成功的索引值
46
47
48 # 获取每一套房子的详情信息
49 def Analysis_html(url_ls, headers):
50     for i in url_ls:
51         r = requests.get(i, headers=headers)
52         html = etree.HTML(r.text)
53         name = html.xpath("//h1/text()")  # 在获取房名
54         price = html.xpath("//span[@class='total']/text()")  # 获取总价
55         area = html.xpath("//div[@class='area']/div[1]/text()")  # 获取面积
56         priceAvg = html.xpath("//span[@class='unitPriceValue']/text()")  # 获取每平方的价格
57         houseType = html.xpath("//div[@class='room']/div[@class='mainInfo']/text()")  # 获取房屋类型
58         orientation = html.xpath("//div[@class='type']/div[@class='mainInfo']/text()")  # 获取房屋朝向
59         city = html.xpath("//div[4]/div/div/a[1]/text()")  # 获取城市
60         district = html.xpath("//div[@class='areaName']/span[@class='info']/a[1]/text()")  # 获取地区
61         community = html.xpath("//div[@class='communityName']//a[1]/text()")  # 获取社区
62         decoration = html.xpath("//div[@class='base']/div[@class='content']/ul/li[9]/text()")  # 获取装修情况
63         propertyRight = html.xpath(
64             "//div[@class='transaction']/div[@class='content']/ul/li[6]/span[2]/text()")  # 获取房屋产权
65         lift = html.xpath("//div[@class='base']/div[@class='content']/ul/li[11]/text()")  # 获取电梯情况
66         lifeRate = html.xpath("//div[@class='base']/div[@class='content']/ul/li[10]/text()")  # 获取梯户比例
67         builtType = html.xpath("//div[@class='base']/div[@class='content']/ul/li[6]/text()")  # 获取建筑类型
68         builtStructure = html.xpath("//div[@class='base']/div[@class='content']/ul/li[8]/text()")  # 获取建筑结构
69         # 爬取过程中可能会出现广告,异常捕获跳过
70         try:
71             # 将爬取下来的数据存储到数据库
72             Save_data(name, price, area, priceAvg, houseType, orientation, city, district, community, decoration,
73                       propertyRight, lift, lifeRate, builtType, builtStructure)
74             print(name, price, area, priceAvg, houseType, orientation, city, district, community, decoration,
75                       propertyRight, lift, lifeRate, builtType, builtStructure)
76         except:
77             continue
78         # 设置休眠实现
79         time.sleep(random.randint(1, 3))
2.对数据进行清洗和处理
将多余的字符去掉并将某些需要计算的列转为数值类型
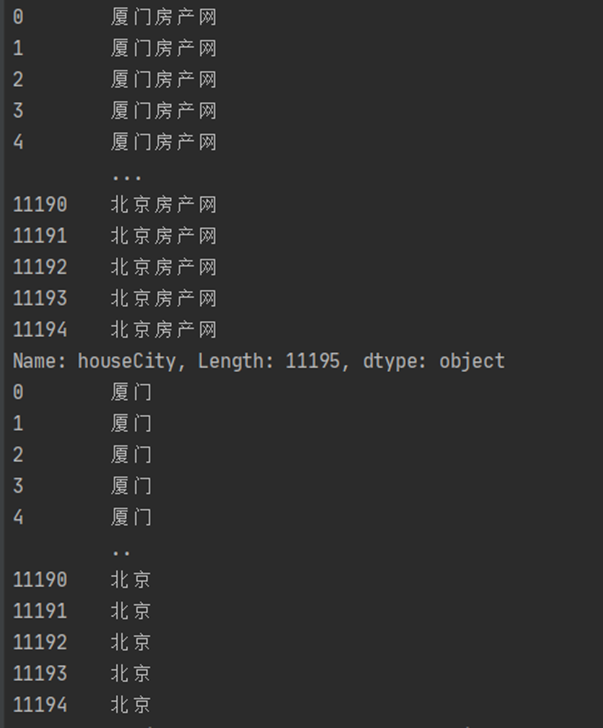
1 # 数据清洗
2 def data_clean(df):
3     print(df.houseCity)
4     # 将城市列的后三个字房地产去掉
5     df['houseCity'] = df['houseCity'].str.strip('房产网')
6     # 将字符串转换为数值,用于接下来的统计
7     df['housePrice'] = df['housePrice'].astype(float, errors='raise')
8     df['housePriceAvg'] = df['housePriceAvg'].astype(float, errors='raise')
9     print(df.houseCity)
处理每个城市房价和平米价格的数据

 1 # 生成城市房价图和每平米价格图所需数据
 2 def get_house_price(df):
 3     # 获取最贵的单价数据
 4     maxPrice = df['housePrice'].max(axis=0)
 5     # 将数据帧里的数据,按城市分组,求房价和平米价的平均值保留1位小数
 6     housePriceList = round(df.groupby(['houseCity'])['housePrice'].mean(), 1)
 7     houseUnitPriceList = round(df.groupby(['houseCity'])['housePriceAvg'].mean(), 1)
 8     # 转为数据帧(因为使用mean方法的返回值是序列)
 9     housePriceList = pd.DataFrame({'houseCity': housePriceList.index, 'housePriceAvg': housePriceList.values})
10     houseUnitPriceList = pd.DataFrame(
11         {'houseCity': houseUnitPriceList.index, 'houseUnitPriceAvg': houseUnitPriceList.values})
12     # 排序,按照房价这个字段降序,ascending True降序
13     housePriceList.sort_values(by=['housePriceAvg'], axis=0, ascending=[True], inplace=True)
14     # 将俩个数据帧以城市名为关联字段,重新级联,保持数据位置的一致性
15     cityAvg = pd.merge(housePriceList, houseUnitPriceList, on='houseCity', how='inner')
16     # 以下将数据转为列表返回前端用于图标生成
17     cityList = np.array(cityAvg.houseCity)
18     cityList = cityList.tolist()
19     priceList = np.array(cityAvg.housePriceAvg)
20     priceList = priceList.tolist()
21     unitPriceList = np.array(cityAvg.houseUnitPriceAvg)
22     unitPriceList = unitPriceList.tolist()
23     print(cityList, priceList, unitPriceList)
24     return cityList, priceList, unitPriceList, len(cityList), len(df), maxPrice, housePriceList.houseCity[0]
处理所选城市户型、区县户数、装修情况、建筑类型的数据

 1 # 四张饼图生成
 2 def get_pie(df, cityName=None):
 3     # 如果有传入城市参数,将数据帧缩小到该城市数据
 4     if cityName != None:
 5         df = df[df['houseCity'].str.contains(cityName)]
 6     # 使用size统计每个列里面字段出现过的次数
 7     houseTypeList = df.groupby(['houseType']).size()
 8     houseDistrictList = df.groupby(['houseDistrict']).size()
 9     houseDecorationList = df.groupby(['houseDecoration']).size()
10     builtTypeList = df.groupby(['builtType']).size()
11
12     # 将各个字段的值以字典的格式添加到临时列表里面
13     templist = []
14     for i, j in zip(houseTypeList.index, houseTypeList.values):
15         templist.append({'value': str(j), 'name': str(i)})
16     templist1 = []
17     for i, j in zip(houseDistrictList.index, houseDistrictList.values):
18         templist1.append({'value': str(j), 'name': str(i)})
19
20     templist2 = []
21     for i, j in zip(houseDecorationList.index, houseDecorationList.values):
22         templist2.append({'value': str(j), 'name': str(i)})
23     templist3 = []
24     for i, j in zip(builtTypeList.index, builtTypeList.values):
25         templist3.append({'value': str(j), 'name': str(i)})
26     all_list = []
27     all_list.append(templist)
28     all_list.append(templist1)
29     all_list.append(templist2)
30     all_list.append(templist3)
31     print(all_list)
32     return all_list
处理每个城市的区县单价数据

 1 # 城市里各区县的单价统计
 2 def analyse_district(df, cityName=None):
 3     if cityName != None:
 4         df = df[df['houseCity'].str.contains(cityName)]
 5     houseDistrictPrice = round(df.groupby(['houseDistrict'])['housePrice'].mean(), 1)
 6
 7     districtList = np.array(houseDistrictPrice.index)
 8     districtList = districtList.tolist()
 9     priceList = np.array(houseDistrictPrice.values)
10     priceList = priceList.tolist()
11     print(districtList,'\n', priceList)
12     return districtList, priceList
3. 文本分析
分析每个城市的小区的热门程度

 1 # 词云生成
 2 def wordCloud(df):
 3     # 循环生成每个城市的词云
 4     for i in df.houseCity.unique():
 5         if os.path.exists(r'D:\Python\workspace\HousePriceAnalysis\static\images\\' + i + '.jpg'):
 6             pass
 7         else:
 8             # 分词
 9             df = df[df['houseCity'].str.contains(i)]
10             strAll = ''
11             for j in df['houseCommunity']:
12                 strAll += j
13             cut = jieba.cut(strAll)
14             strList = " ".join(cut)
15             print(strList)
16             # 生成遮罩
17             img = Image.open(r'D:\Python\workspace\HousePriceAnalysis\static\images\遮罩.jpg')
18             img_array = np.array(img)  # 图片转为数组
19             wc = WordCloud(
20                 background_color='white',
21                 mask=img_array,
22                 font_path="simhei.ttf",
23                 height=100,
24                 width=300
25             )
26             wc.generate_from_text(strList)
27             # fig = plt.figure(1)
28             plt.imshow(wc)
29             plt.axis('off')
30             plt.savefig(r'D:\Python\workspace\HousePriceAnalysis\static\images\%s.jpg' % i)
4. 数据分析与可视化
城市房价图和每平米的价格图,可以清晰的看见几个城市的数据对比。北京无愧于帝都的称号,在房价方面还是遥遥领先。

 1 var chartDom = document.getElementById('main1');
 2 var myChart = echarts.init(chartDom);
 3 var option;
 4 option = {
 5   title: {
 6     text: '每平米价格图'
 7   },
 8   tooltip: {
 9     trigger: 'axis',
10     axisPointer: {
11       type: ''
12     }
13   },
14   legend: {},
15   grid: {
16     left: '3%',
17     right: '4%',
18     bottom: '3%',
19     containLabel: true
20   },
21   xAxis: {
22     type: 'value',
23     boundaryGap: [0, 0.01]
24   },
25   yAxis: {
26     type: 'category',
27     data: {{cityList|safe}}
28   },
29   series: [
30     {
31       name: '每平米价格/元',
32       type: 'bar',
33       data: {{unitPriceList|safe}}
34     }
35   ]
36 };
37 option && myChart.setOption(option);
38
39 var chartDom = document.getElementById('main');
40 var myChart = echarts.init(chartDom);
41 var option;
42 option = {
43   title: {
44     text: '城市房价图'
45   },
46   tooltip: {
47     trigger: 'axis',
48     axisPointer: {
49       type: ''
50     }
51   },
52   legend: {},
53   grid: {
54     left: '3%',
55     right: '4%',
56     bottom: '3%',
57     containLabel: true
58   },
59   xAxis: {
60     type: 'value',
61     boundaryGap: [0, 0.01]
62   },
63   yAxis: {
64     type: 'category',
65     data: {{cityList|safe}}
66   },
67   series: [
68     {
69       name: '平均房价/万元',
70       type: 'bar',
71       data: {{priceList|safe}}
72     }
73   ]
74 };
75 option && myChart.setOption(option);
每个城市的房子户型占比图、各区房屋数量图、装修情况图、建筑类型图,可以看到的是福州的二手房最主要还是以3室2厅为主,闽侯县、仓山区、鼓楼区、晋安区的房屋占据福州二手房的主要部分,装修情况精装过半,建筑类型多为板楼
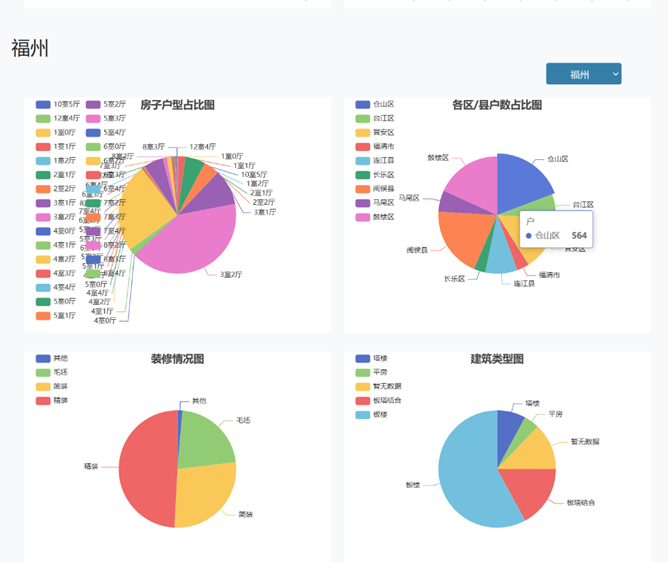
 1 var chartLegend=['房子户型占比图','各区/县户数占比图','装修情况图','建筑类型图']
 2                 all_list = json.all_list
 3                 for(var i=2;i<6;i++){
 4                     tempList = all_list[i-2]
 5                     var chartDom = document.getElementById('main'+i);
 6                     var myChart = echarts.init(chartDom);
 7                     var option;
 8
 9                     option = {
10                       title: {
11                         text: chartLegend[i-2],
12                         left: 'center'
13                       },
14                       tooltip: {
15                         trigger: 'item'
16                       },
17                       legend: {
18                         orient: 'vertical',
19                         left: 'left'
20                       },
21                       series: [
22                         {
23                           name: '户',
24                           type: 'pie',
25                           radius: '50%',
26                           data: tempList,
27                           emphasis: {
28                             itemStyle: {
29                               Blur: 10,
30                               OffsetX: 0,
31                               Color: 'rgba(0, 0, 0, 0.5)'
32                             }
33                           }
34                         }
35                       ]
36                     };
37                     option && myChart.setOption(option);
各个区的房屋均价,可以根据所选城市查看,现在可以看见的是鼓楼区的价格是福州最高的。
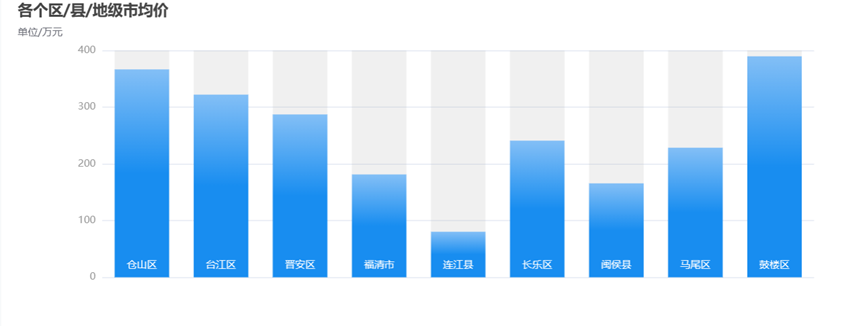
 1 var chartDom = document.getElementById('main6');
 2                 var myChart = echarts.init(chartDom);
 3                 var option;
 4                 let dataAxis = json.districtList;
 5                 // prettier-ignore
 6                 let data = json.priceList;
 7                 let yMax = 500;
 8                 let dataShadow = [];
 9                 for (let i = 0; i < data.length; i++) {
10                   dataShadow.push(yMax);
11                 }
12                 option = {
13                   title: {
14                     text: '各个区/县/地级市均价',
15                     subtext: '单位/万元'
16                   },
17                   xAxis: {
18                     data: dataAxis,
19                     axisLabel: {
20                       inside: true,
21                       color: '#fff'
22                     },
23                     axisTick: {
24                       show: false
25                     },
26                     axisLine: {
27                       show: false
28                     },
29                     z: 10
30                   },
31                   yAxis: {
32                     axisLine: {
33                       show: false
34                     },
35                     axisTick: {
36                       show: false
37                     },
38                     axisLabel: {
39                       color: '#999'
40                     }
41                   },
42                   dataZoom: [
43                     {
44                       type: 'inside'
45                     }
46                   ],
47                   series: [
48                     {
49                       type: 'bar',
50                       showBackground: true,
51                       itemStyle: {
52                         color: new echarts.graphic.LinearGradient(0, 0, 0, 1, [
53                           { offset: 0, color: '#83bff6' },
54                           { offset: 0.5, color: '#188df0' },
55                           { offset: 1, color: '#188df0' }
56                         ])
57                       },
58                       emphasis: {
59                         itemStyle: {
60                           color: new echarts.graphic.LinearGradient(0, 0, 0, 1, [
61                             { offset: 0, color: '#2378f7' },
62                             { offset: 0.7, color: '#2378f7' },
63                             { offset: 1, color: '#83bff6' }
64                           ])
65                         }
66                       },
67                       data: data
68                     }
69                   ]
70                 };
71                 // Enable data zoom when user click bar.
72                 const zoomSize = 6;
73                 myChart.on('click', function (params) {
74                   console.log(dataAxis[Math.max(params.dataIndex - zoomSize / 2, 0)]);
75                   myChart.dispatchAction({
76                     type: 'dataZoom',
77                     startValue: dataAxis[Math.max(params.dataIndex - zoomSize / 2, 0)],
78                     endValue:
79                       dataAxis[Math.min(params.dataIndex + zoomSize / 2, data.length - 1)]
80                   });
81                 });
82                 option && myChart.setOption(option);
5.数据持久化
将数据存储到关系型数据库内

 1 # 存储数据库函数
 2 def Save_data(name, price, area, priceAvg, houseType, orientation, city, district, community, decoration, propertyRight,
 3               lift, lifeRate, builtType, builtStructure):
 4     result = []
 5     result = name + price + area + priceAvg + houseType + orientation + city + district + community + decoration + propertyRight + lift + lifeRate + builtType + builtStructure
 6
 7     # 存储在数据库
 8     houseDetail = models.house(houseName=result[0], housePrice=result[1], houseArea=result[2], housePriceAvg=result[3],
 9                                houseType=result[4], houseOrientation=result[5], houseCity=result[6],
10                                houseDistrict=result[7],
11                                houseCommunity=result[8], houseDecoration=result[9], propertyRight=result[10],
12                                lift=result[11], lifeRate=result[12], builtType=result[13], builtStructure=result[14])
13     houseDetail.save()
6. 主要代码汇总
  1 """
  2     @Name:rj
  3     @Class:
  4     @DateTime:2022/12/17 11:09
  5     @SoftWare:PyCharm
  6 """
  7 import numpy as np
  8 import pandas as pd
  9
 10 from rj import models
 11
 12 import os
 13 import jieba
 14 from wordcloud import WordCloud, ImageColorGenerator
 15 from PIL import Image
 16 from matplotlib import pyplot as plt
 17
 18
 19 # 数据清洗
 20 def data_clean(df):
 21     # 将城市列的后三个字房地产去掉
 22     df['houseCity'] = df['houseCity'].str.strip('房产网')
 23     df['housePrice'] = df['housePrice'].astype(float, errors='raise')
 24     df['housePriceAvg'] = df['housePriceAvg'].astype(float, errors='raise')
 25     return df
 26
 27
 28 # 数据转换,将数据转为数据帧
 29 def get_pandas_data():
 30     houseAll = models.house.objects.all()
 31     houseName, housePrice, houseArea, housePriceAvg, houseType, houseOrientation, houseCity, houseDistrict, houseCommunity, houseDecoration, propertyRight, lift, lifeRate, builtType, builtStructure = [], [], [], [], [], [], [], [], [], [], [], [], [], [], []
 32     for i in houseAll:
 33         houseName.append(i.houseName)
 34         housePrice.append(i.housePrice)
 35         houseArea.append(i.houseArea)
 36         housePriceAvg.append(i.housePriceAvg)
 37         houseType.append(i.houseType)
 38         houseOrientation.append(i.houseOrientation)
 39         houseCity.append(i.houseCity)
 40         houseDistrict.append(i.houseDistrict)
 41         houseCommunity.append(i.houseCommunity)
 42         houseDecoration.append(i.houseDecoration)
 43         propertyRight.append(i.propertyRight)
 44         lift.append(i.lift)
 45         lifeRate.append(i.lifeRate)
 46         builtType.append(i.builtType)
 47         builtStructure.append(i.builtStructure)
 48
 49     df = pd.DataFrame(
 50         {'houseName': houseName, 'housePrice': housePrice, 'houseArea': houseArea, 'housePriceAvg': housePriceAvg,
 51          'houseType': houseType, 'houseOrientation': houseOrientation,
 52          'houseCity': houseCity, 'houseDistrict': houseDistrict, 'houseCommunity': houseCommunity,
 53          'houseDecoration': houseDecoration, 'propertyRight': propertyRight, 'lift': lift,
 54          'lifeRate': lifeRate, 'builtType': builtType,
 55          'builtStructure': builtStructure})
 56     df = data_clean(df)
 57     return df
 58
 59
 60 # 生成城市房价图和每平米价格图所需数据
 61 def get_house_price(df):
 62     # 获取最贵的单价数据
 63     maxPrice = df['housePrice'].max(axis=0)
 64     # 将数据帧里的数据,按城市分组,求房价和平米价的平均值保留1位小数
 65     housePriceList = round(df.groupby(['houseCity'])['housePrice'].mean(), 1)
 66     houseUnitPriceList = round(df.groupby(['houseCity'])['housePriceAvg'].mean(), 1)
 67     # 转为数据帧(因为使用mean方法的返回值是序列)
 68     housePriceList = pd.DataFrame({'houseCity': housePriceList.index, 'housePriceAvg': housePriceList.values})
 69     houseUnitPriceList = pd.DataFrame(
 70         {'houseCity': houseUnitPriceList.index, 'houseUnitPriceAvg': houseUnitPriceList.values})
 71     # 排序,按照房价这个字段降序,ascending True降序
 72     housePriceList.sort_values(by=['housePriceAvg'], axis=0, ascending=[True], inplace=True)
 73     # 将俩个数据帧以城市名为关联字段,重新级联,保持数据位置的一致性
 74     cityAvg = pd.merge(housePriceList, houseUnitPriceList, on='houseCity', how='inner')
 75     # 以下将数据转为列表返回前端用于图标生成
 76     cityList = np.array(cityAvg.houseCity)
 77     cityList = cityList.tolist()
 78     priceList = np.array(cityAvg.housePriceAvg)
 79     priceList = priceList.tolist()
 80     unitPriceList = np.array(cityAvg.houseUnitPriceAvg)
 81     unitPriceList = unitPriceList.tolist()
 82
 83     return cityList, priceList, unitPriceList, len(cityList), len(df), maxPrice, housePriceList.houseCity[0]
 84
 85
 86 # 四张饼图生成
 87 def get_pie(df, cityName=None):
 88     # 如果有传入城市参数,将数据帧缩小到该城市数据
 89     if cityName != None:
 90         df = df[df['houseCity'].str.contains(cityName)]
 91     # 使用size统计每个列里面字段出现过的次数
 92     houseTypeList = df.groupby(['houseType']).size()
 93     houseDistrictList = df.groupby(['houseDistrict']).size()
 94     houseDecorationList = df.groupby(['houseDecoration']).size()
 95     builtTypeList = df.groupby(['builtType']).size()
 96
 97     # 将各个字段的值以字典的格式添加到临时列表里面
 98     templist = []
 99     for i, j in zip(houseTypeList.index, houseTypeList.values):
100         templist.append({'value': str(j), 'name': str(i)})
101     templist1 = []
102     for i, j in zip(houseDistrictList.index, houseDistrictList.values):
103         templist1.append({'value': str(j), 'name': str(i)})
104
105     templist2 = []
106     for i, j in zip(houseDecorationList.index, houseDecorationList.values):
107         templist2.append({'value': str(j), 'name': str(i)})
108     templist3 = []
109     for i, j in zip(builtTypeList.index, builtTypeList.values):
110         templist3.append({'value': str(j), 'name': str(i)})
111     all_list = []
112     all_list.append(templist)
113     all_list.append(templist1)
114     all_list.append(templist2)
115     all_list.append(templist3)
116     return all_list
117
118 # 词云生成
119 def wordCloud(df):
120     # 循环生成每个城市的词云
121     for i in df.houseCity.unique():
122         if os.path.exists(r'D:\python\链家热门城市爬取\链家热门城市爬取\HousePriceAnalysis\static\images\\' + i + '.jpg'):
123             pass
124         else:
125             # 分词
126             df = df[df['houseCity'].str.contains(i)]
127             strAll = ''
128             for j in df['houseCommunity']:
129                 strAll += j
130             cut = jieba.cut(strAll)
131             strList = " ".join(cut)
132             print(strList)
133             # 生成遮罩
134
135             img = Image.open(r'D:\python\链家热门城市爬取\链家热门城市爬取\HousePriceAnalysis\static\images\遮罩.jpg')
136             img_array = np.array(img)  # 图片转为数组
137             wc = WordCloud(
138                 background_color='white',
139                 mask=img_array,
140                 font_path="simhei.ttf",
141                 height=100,
142                 width=300
143             )
144             wc.generate_from_text(strList)
145             # fig = plt.figure(1)
146             plt.imshow(wc)
147             plt.axis('off')
148             plt.savefig(r'D:\python\链家热门城市爬取\链家热门城市爬取\HousePriceAnalysis\static\images\%s.jpg' % i)
149
150
151 # 城市里各区县的单价统计
152 def analyse_district(df, cityName=None):
153     if cityName != None:
154         df = df[df['houseCity'].str.contains(cityName)]
155     houseDistrictPrice = round(df.groupby(['houseDistrict'])['housePrice'].mean(), 1)
156
157     districtList = np.array(houseDistrictPrice.index)
158     districtList = districtList.tolist()
159     priceList = np.array(houseDistrictPrice.values)
160     priceList = priceList.tolist()
161     return districtList, priceList
162
163 """
164     @Name:rj
165     @Class:
166     @DateTime:2022/9/24 l0:3l
167     @SoftWare:PyCharm
168 """
169 import requests, time, csv
170 from lxml import etree
171 import random
172 from rj import models
173
174
175 # 每个城市有100页的地址,将拼接后的数据装入列表后返回
176 def Get_url(url):
177     all_url = []
178     for i in range(1, 101):
179         all_url.append(url + 'pg' + str(i) + '/')
180     return all_url
181
182
183 # 获取每一个页面里面每一套房的url
184 def Get_house_url(all_url, headers):
185     num = 0
186     # 简单统计页数
187     for i in all_url:
188         # 获取当前页面的代码
189         r = requests.get(i, headers=headers)
190         html = etree.HTML(r.text)
191         # 使用xpath匹配该页面每套房子的url,将会以列表形式存储
192         url_ls = html.xpath("//ul[@class ='sellListContent']/li/a/@href")
193         # 爬取房子详情页的内容
194         Analysis_html(url_ls, headers)
195         time.sleep(4)
196         num += 1
197         print("第%d页爬完了" % num)  # num记录爬取索成功的索引值
198
199
200 # 获取每一套房子的详情信息
201 def Analysis_html(url_ls, headers):
202     for i in url_ls:
203         r = requests.get(i, headers=headers)
204         html = etree.HTML(r.text)
205         name = html.xpath("//h1/text()")  # 在获取房名
206         price = html.xpath("//span[@class='total']/text()")  # 获取总价
207         area = html.xpath("//div[@class='area']/div[1]/text()")  # 获取面积
208         priceAvg = html.xpath("//span[@class='unitPriceValue']/text()")  # 获取每平方的价格
209         houseType = html.xpath("//div[@class='room']/div[@class='mainInfo']/text()")  # 获取房屋类型
210         orientation = html.xpath("//div[@class='type']/div[@class='mainInfo']/text()")  # 获取房屋朝向
211         city = html.xpath("//div[4]/div/div/a[1]/text()")  # 获取城市
212         district = html.xpath("//div[@class='areaName']/span[@class='info']/a[1]/text()")  # 获取地区
213         community = html.xpath("//div[@class='communityName']//a[1]/text()")  # 获取社区
214         decoration = html.xpath("//div[@class='base']/div[@class='content']/ul/li[9]/text()")  # 获取装修情况
215         propertyRight = html.xpath(
216             "//div[@class='transaction']/div[@class='content']/ul/li[6]/span[2]/text()")  # 获取房屋产权
217         lift = html.xpath("//div[@class='base']/div[@class='content']/ul/li[11]/text()")  # 获取电梯情况
218         lifeRate = html.xpath("//div[@class='base']/div[@class='content']/ul/li[10]/text()")  # 获取梯户比例
219         builtType = html.xpath("//div[@class='base']/div[@class='content']/ul/li[6]/text()")  # 获取建筑类型
220         builtStructure = html.xpath("//div[@class='base']/div[@class='content']/ul/li[8]/text()")  # 获取建筑结构
221         # 爬取过程中可能会出现广告,异常捕获跳过
222         try:
223             # 将爬取下来的数据存储到数据库
224             Save_data(name, price, area, priceAvg, houseType, orientation, city, district, community, decoration,
225                       propertyRight, lift, lifeRate, builtType, builtStructure)
226             print(name, price, area, priceAvg, houseType, orientation, city, district, community, decoration,
227                       propertyRight, lift, lifeRate, builtType, builtStructure)
228         except:
229             continue
230         # 设置休眠实现
231         time.sleep(random.randint(1, 3))
232
233
234 # 存储数据库函数
235 def Save_data(name, price, area, priceAvg, houseType, orientation, city, district, community, decoration, propertyRight,
236               lift, lifeRate, builtType, builtStructure):
237     result = []
238     result = name + price + area + priceAvg + houseType + orientation + city + district + community + decoration + propertyRight + lift + lifeRate + builtType + builtStructure
239
240     # 存储在数据库
241     houseDetail = models.house(houseName=result[0], housePrice=result[1], houseArea=result[2], housePriceAvg=result[3],
242                                houseType=result[4], houseOrientation=result[5], houseCity=result[6],
243                                houseDistrict=result[7],
244                                houseCommunity=result[8], houseDecoration=result[9], propertyRight=result[10],
245                                lift=result[11], lifeRate=result[12], builtType=result[13], builtStructure=result[14])
246     houseDetail.save()
247     # 存储在csv文件
248     with open(r'二手房房价2.csv', 'a', encoding='utf_8_sig', newline='')as f:
249         wt = csv.writer(f)
250         wt.writerow(result)
251         print('已写入')
252         f.close()
253
254
255 # 爬虫启动方法
256 def start():
257     # 爬取所需城市的名称缩写,用于地址拼接,链家网站福建省内支持的城市仅有以下四个、支持的城市列表可以查看https://map.lianjia.com/map/350200/ESF/
258     #cityList = ['xm', 'fz', 'quanzhou', 'zhangzhou']
259     cityList = ['sh']
260     # 设置请求头,以防被网站识别为爬虫
261     headers = {
262         "Upgrade-Insecure-Requests": "1",
263         "User-Agent": "Mozilla/5.0 (Windows NT 10.0; Win64; x64) AppleWebKit/537.36 (KHTML, like Gecko) Chrome/108.0.0.0 Safari/537.36 Edg/108.0.1462.46",
264         "Cookie": "lianjia_uuid=60c54ae6-6b42-4222-8692-efe4fb2c554e; crosSdkDT2019DeviceId=eu2b5l-mfq32x-njycw4jyhevekso-ud4cezlw8; _smt_uid=632e762f.20c8106d; _ga=GA1.2.203719967.1663989297; Hm_lvt_9152f8221cb6243a53c83b956842be8a=1669339641; lianjia_ssid=917d080d-af96-4114-92ce-e9ec6ded0cde; _gid=GA1.2.1343492366.1671084252; lianjia_token=2.0111ad29317b6152f82536df72a8e72e0777cf78c4; beikeBaseData=%7B%22parentSceneId%22:%226413099907731748097%22%7D; sensorsdata2015jssdkcross=%7B%22distinct_id%22%3A%221836d7da82957c-0d0e66116b0617-78565473-1327104-1836d7da82a940%22%2C%22%24device_id%22%3A%221836d7da82957c-0d0e66116b0617-78565473-1327104-1836d7da82a940%22%2C%22props%22%3A%7B%22%24latest_traffic_source_type%22%3A%22%E7%9B%B4%E6%8E%A5%E6%B5%81%E9%87%8F%22%2C%22%24latest_referrer%22%3A%22%22%2C%22%24latest_referrer_host%22%3A%22%22%2C%22%24latest_search_keyword%22%3A%22%E6%9C%AA%E5%8F%96%E5%88%B0%E5%80%BC_%E7%9B%B4%E6%8E%A5%E6%89%93%E5%BC%80%22%7D%7D; Hm_lpvt_9152f8221cb6243a53c83b956842be8a=1671089180; select_city=350200"
265     }
266     # 写入csv文件,只是备份一份数据,后面并无用到
267     with open(r'二手房房价2.csv', 'a', encoding='utf_8_sig', newline='')as f:
268         table_label = ['房屋名称', '房屋总价', '建筑面积', '每平方价格', '房屋户型', '房屋朝向',
269                        '城市', '地区', '小区名称', '装修情况', '房屋产权', '电梯情况', '梯户比例', '建筑类型', '建筑结构']
270         wt = csv.writer(f)
271         wt.writerow(table_label)
272     # 按城市列表里的值进行第一轮地址拼接
273     for i in cityList:
274         url = 'https://' + i + '.lianjia.com/ershoufang/'
275         # url = 'https://xm.lianjia.com/ershoufang/'
276         # 第二轮城市地址拼接
277         all_url = Get_url(url)
278         # 将所有url地址和请求头传入方法内进行采集
279         Get_house_url(all_url, headers)
280
281
282 from django.http import HttpResponse, JsonResponse
283 from django.shortcuts import render
284
285 # Create your views here.
286 from django.views.decorators.clickjacking import xframe_options_exempt
287 from django.views.decorators.csrf import csrf_exempt
288 import numpy as np
289
290 from rj import models
291 from rj.utils import crawl, analyse
292
293
294 def index(request):
295     return render(request, 'Index.html')
296
297
298 def spider_view(request):
299     return render(request, 'Spider.html')
300
301
302 # 词云
303 def wordcloud_view(request):
304     return render(request, 'WordCloud.html')
305
306
307 @xframe_options_exempt  # 使iframe可用
308 @csrf_exempt  # 取消csrf限制
309 def crawlData_view(request):
310     # if len(models.house.objects.all()) < 5000:
311     #     crawl.start()
312     crawl.start()
313     return JsonResponse({"flag": "爬取成功"})
314
315
316 @xframe_options_exempt  # 使iframe可用
317 @csrf_exempt  # 取消csrf限制
318 def analyse_view(request):
319     df = analyse.get_pandas_data()
320     if request.method == 'POST':
321         cityName = request.POST.get('cityName')
322         all_list = analyse.get_pie(df, cityName)
323         districtList, priceList = analyse.analyse_district(df, cityName)
324         return JsonResponse(
325             {"all_list": all_list, "cityName": cityName, 'districtList': districtList, 'priceList': priceList})
326     else:
327         cityName = request.GET.get('cityName')
328
329     cityList, priceList, unitPriceList, cityNum, itemCount, maxPrice, MEcity = analyse.get_house_price(df)
330     all_list = analyse.get_pie(df)
331     analyse.wordCloud(df)
332     return render(request, 'Analysis.html',
333                   {"cityList": cityList, 'priceList': priceList, 'unitPriceList': unitPriceList, 'cityNum': cityNum,
334                    'itemCount': itemCount, 'maxPrice': maxPrice, 'all_list': all_list, 'MEcity': MEcity})
五、 总结
1. 经过对链家二手房数据的分析与可视化,可以看出,北京是爬取城市里最贵的,漳州相较于其他城市而言相对比较便宜。
2. 在这次实验过程中掌握了爬虫这门技术,并对大数据分析也有了更进一步的了解,通过这次的实验我发下编程不要急于求成,在后期的实验数据处理、结果分析阶段,如何将具体的实验数据整理、分析,从中提炼出对我们的分析有用的数据,是对我分析、研究能力的考验。通过这次的实验、研究,我在创新能力、动手能力、以及专业知识等方面都有不同程度的收获。


【推荐】国内首个AI IDE,深度理解中文开发场景,立即下载体验Trae
【推荐】编程新体验,更懂你的AI,立即体验豆包MarsCode编程助手
【推荐】抖音旗下AI助手豆包,你的智能百科全书,全免费不限次数
【推荐】轻量又高性能的 SSH 工具 IShell:AI 加持,快人一步
· Manus重磅发布:全球首款通用AI代理技术深度解析与实战指南
· 被坑几百块钱后,我竟然真的恢复了删除的微信聊天记录!
· 没有Manus邀请码?试试免邀请码的MGX或者开源的OpenManus吧
· 园子的第一款AI主题卫衣上架——"HELLO! HOW CAN I ASSIST YOU TODAY
· 【自荐】一款简洁、开源的在线白板工具 Drawnix