Profiler Window 学习
https://docs.unity3d.com/2018.4/Documentation/Manual/Profiler.html
Getting started with the Profiler window
Global Illumination Profiler module
Getting started with the Profiler window
Profiling your application
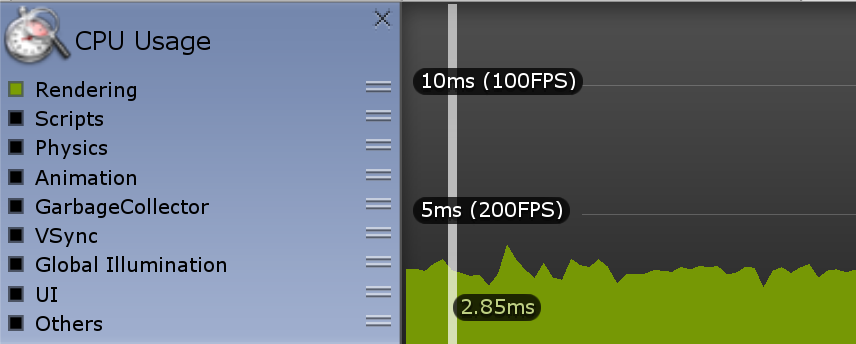
CPU Usage Profiler module
CPU Usage charts
Rendering How much time your application spends on rendering graphics
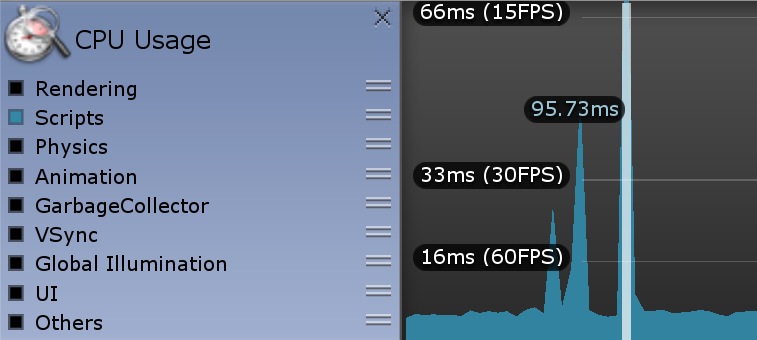
Scripts How much time your application spends on running scripts
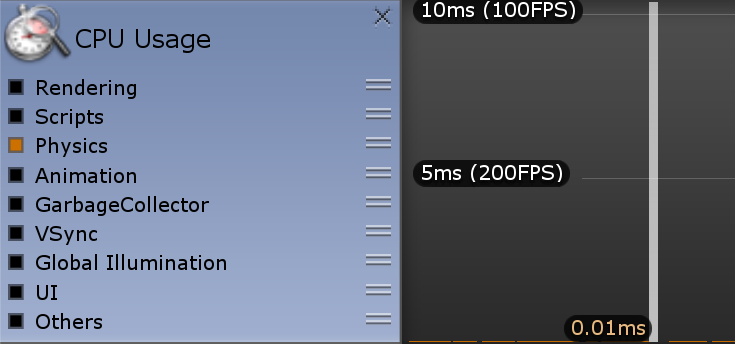
Physics How much time your application spends on the physics engine
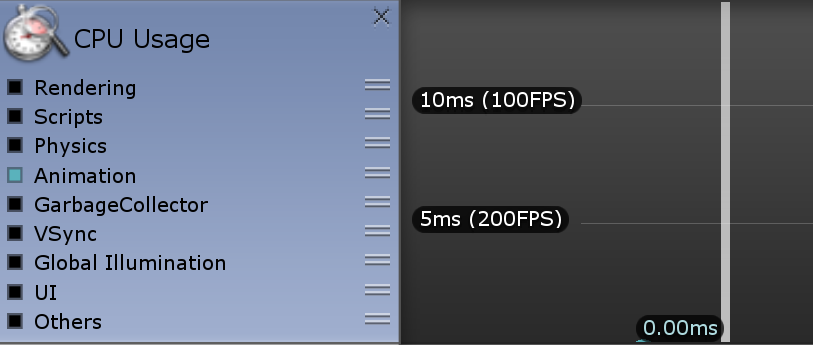
Animation How much time your application spends on animating SkinnedMeshRenderers, GameObjects and other components in your application. This also includes the time spent on some calculations for systems the Animation and Animator components utilize
GarbageCollector How muc time your application spends on running the Garbage Collector
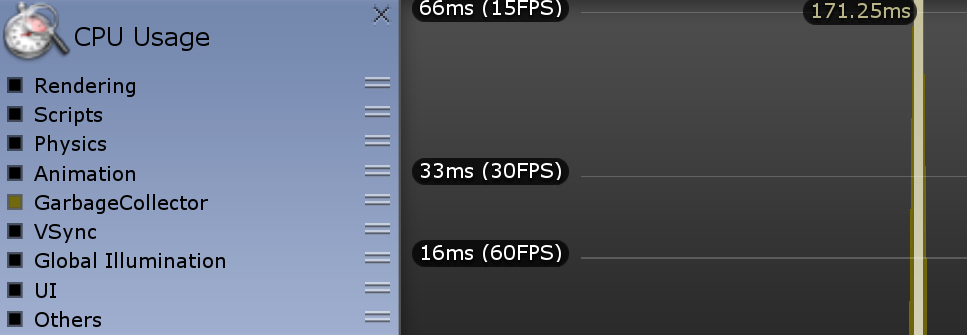
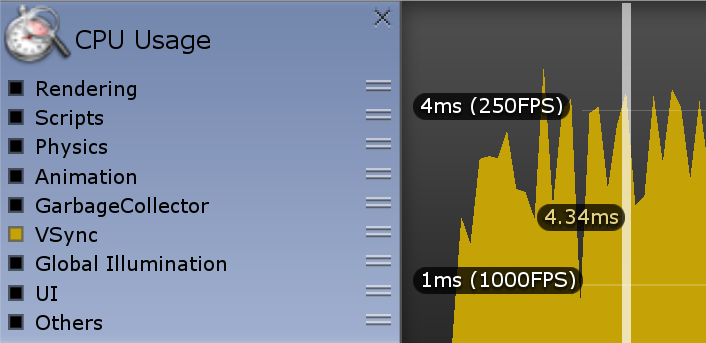
VSync How much time is spent in a frame waiting for the targetFrameRate on the next VBlank to sync with. This is according to the QualitySettings.vSyncCount value, or the target framerate, or the VSync setting that is the default or enforced maximum of the platform your application is running on.
Global Illumination How much time is spent on lighting in your application

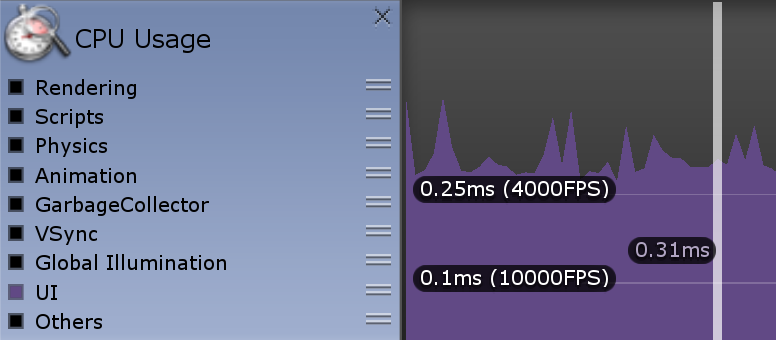
UI How much time is spent on displaying your application's UI
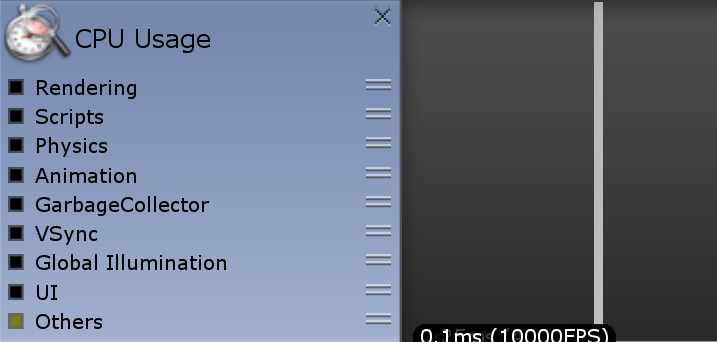
Others How much time is spent in code that does not fall in any of the other categories, for instance the entire EditorLoop, or the Profiling overhead when profiling Playmode in the Editor
CPU Usage module details pane
Timeline view
Hierarchy and Raw Hierarchy view
Common samples
Performance warnings
Allocation Callstacks
Editor only samples
Rendering Profiler module
SetPass Calls Draw Calls Total Batches Tris Verts
(Dynamic Batching) Batched Draw Calls Batches Tris Verts
(Static Batching) Batched Draw Calls Batches Tris Verts
Memory Profiler module
When you profile your application in the Editor, all of the numbers the Memory module displays indicates the memory usage in the Editor, and not the application’s release platform. These numbers are generally larger than when running on the release platform, because running the Unity Editor uses specific objects that take up memory, and the Editor window uses extra memory. Additionally, the memory that the Profiler itself uses is displayed, since Unity cannot cleanly separate it from the memory that the Play mode Player uses.
Chart categories
Total Allocated
Simple view
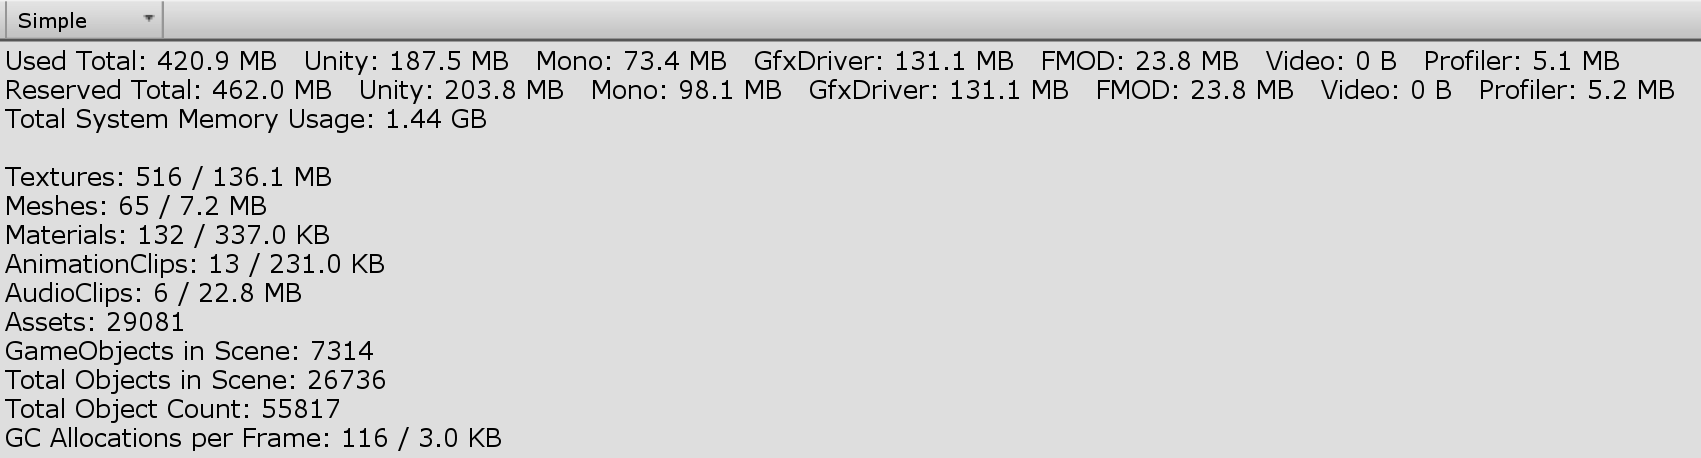
Total: Accumulated value from all areas below
Unity: The amount of memory allocations in native Unity code, tracked by the native memory manager system and allocated in memory pools according to their type, source and platform specific allocation patterns.
Mono: The total heap size and used heap size managed code uses. This memory is garbage collected.
GfxDriver: The estimated amount of memory the driver uses on Textures, render targets, Shaders, and Mesh data
Audio: The Audio system's estimated memory usage
Video: The Video system's estimated memory usage
Profiler: Total memory the Profiler uses
Detailed view
Audio Profiler module
Physics Profiler module
GPU Profiler module
Global Illumination Profiler module
UI Profiler module


 浙公网安备 33010602011771号