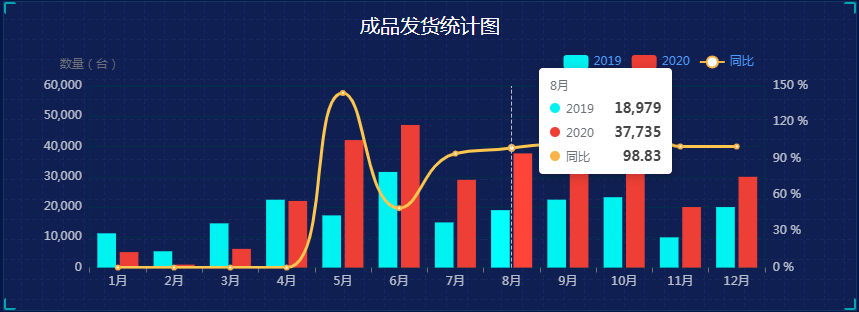
// 折线和柱型图组合
$(document).ready(function () {
  // 基于准备好的dom,初始化echarts实例
  var myChart = echarts.init(document.querySelector(".mes9 .chart"));

  // 2. 指定配置和数据
  myChart.setOption ({
    color: ["#00f2f1", "#ed3f35","#F8B448"],
    tooltip: {
      // 通过坐标轴来触发
      trigger: "axis",
      //formatter: '{b0}<br />{a}{c}'
    },
    legend: {
      // 距离容器10%
       right: "10%",
      // 修饰图例文字的颜色
      textStyle: {
        color: "#4c9bfd"
      }
    },
    grid: {
      top: "15%",
      left: "3%",
      right: "4%",
      bottom: "1%",
      show: true,
      borderColor: "#012f4a",
      containLabel: true
    },

    xAxis: {
      type: "category",
      // 去除刻度
      axisTick: {
        show: true
      },
      // 修饰刻度标签的颜色
      axisLabel: {
        interval:0,  //0强制显示所有标签,如果设置为1,表示隔一个标签显示一个标签,如果为3,表示隔3个标签显示一个标签
        //rotate:40, //标签倾斜的角度,在类目轴的类目标签显示不全时可以通过旋转防止标签重叠(官方这样说的)旋转的角度是-90到90度
        color: "rgba(255,255,255,.7)"
      },
      // 去除x坐标轴的颜色
      axisLine: {
        show: false
      }
    },

    //设置两个y轴,左边显示数量,右边显示概率
    yAxis: [
    {
      type: "value",
      name: '数量(台)',  //左边显示
      //splitNumber: 10,//坐标轴的分割段数
      show:true,
      //interval: 50,
      // 去除刻度
      axisTick: {
        show: false
      },
      splitLine: {
                    show: false//是否显示分隔线。
                },
      axisLabel: {
                    color: "rgba(255,255,255,.7)"   // 修饰刻度标签的颜色
                },
          // 修改y轴分割线的颜色
          splitLine: {
                   lineStyle: {
                        color: "#012f4a"
                              }
                    },
      },

      {
             type: 'value',
             //name: '增长率',
             min: 0,
             max: 150,
            // interval: 10,   //百分比间隔数

             axisTick: {
                          show: false   // 去除刻度
                       },
             splitLine: {
                          show: false//是否显示分隔线。
                        },
             axisLabel: {
                          color: "rgba(255,255,255,.7)" ,  // 修饰刻度标签的颜色
                          formatter: '{value} %'
                        }
      }


      ],

    dataset: {
          //指示名称
         dimensions: ['product',  '2019', '2020','同比'],
         source: [ ]
      },
    series: [
      {
       // name: "发货",
        type: "bar",
        //barWidth: "20%",
      },
      {
        type: "bar",
      },
      {
        type: "line",
        yAxisIndex: 1,    //这里要设置哪个y轴,默认是最左边的是0,然后1,2顺序来。
        smooth: true,   // 是否让线条圆滑显示
        label : {
                            show : false,
                            position : 'top',
                            //formatter: '{c} %',
                            textStyle : {
                                //fontSize : '14',
                                color: "rgba(255,255,255,.7)"
                            }
                }
      }
    ]
  });
    //第一次加载
    myChart.showLoading();
       // 异步加载数据
   //$.get('dateplan.json').done(function (data) {
   $.get('data2.json').done(function (data) {
    myChart.hideLoading();
      myChart.setOption({
      dataset:{  source:data.source  },
  });

  window.addEventListener("resize", function () {
    myChart.resize();
  });

});

});

中年大叔学Delphi


 浙公网安备 33010602011771号