
Data-Informed Product Building - Sequoia Capital
Intro:
随着科技发展, 创造一个产品变得越来越容易, 产品获得100万活跃用户所需的周期大大缩短.
随之而来的是, 产品创造了更多的数据, 有策略地采集并且分析这些数据变得前所未有的重要.
这些数据的价值不仅仅是简单的计数和制作dashboard, 还在于能帮助定义目标, roadmaps和策略.
在后续给出了关于分析工具, 方法的一系列guideline, 以阐述如何打造一个data-informed的产品
从概念到成熟, 成功产品的特征
对于强势产品, 它的成长曲线往往是S型的, 增长的斜率呈现: 慢->快->慢的趋势
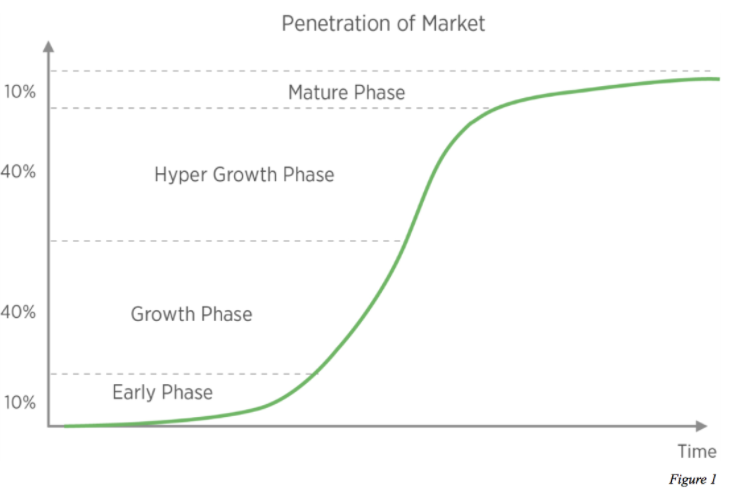
early phase
找到少数"热爱"产品的一批用户, 比找到一群只是"喜欢"产品的用户更重要
第一个月只有MAU, 全是新增用户, 没有流失或回流用户
第二个月, 没有回流用户, 开始出现churn users
第三个月, 尽管主要还是取决于new, 但churn开始发挥作用. month over month的净增用户完全依赖于Quick Ratio: (new + resurrected) / churned
new user
churned user
resurrected user
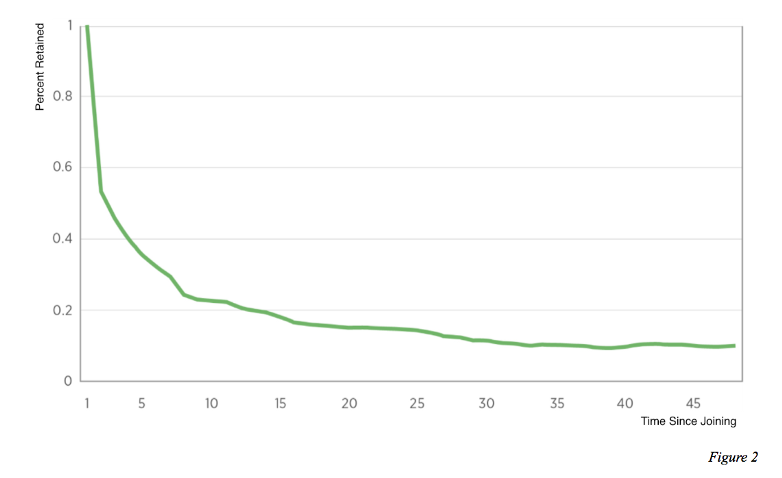
强产品: 留存率曲线会出现上升, 并且最终flatten
弱产品: 留存率曲线不会flatten, 最终降至0
在early phase, churn的作用远超resurrection和new
留存率曲线的flatten背后是churn和resurrection的平衡.
early phase产品的健康度可参考如下:
相比市占率类似的产品, 该产品有较好的留存率
"热爱"产品的用户群, 呈现非常高的留存率
new users在active users中占比最高
growth phase
growth accelerates as you begin to achieve product-market fit
as the retained population increases, new users become a maller percentage of MAU
in older cohorts, retention stabilizes as balance between resurrection and churn is achieved
while in newer cohorts, churn continues to far exceed resurrection
hyper growth phase
the ratio of resurrection to churn improves
MAU grows dramatically as resurrection exceeds churn, and new users continue growing
engagement metrics are very strong
mature phase
resurrection and churn have balanced
the number of new users is extremely small compared to that of retained users
engagement metrics are retained at very high levels
expanding product lines
releasing of new products to drive new growth

 浙公网安备 33010602011771号