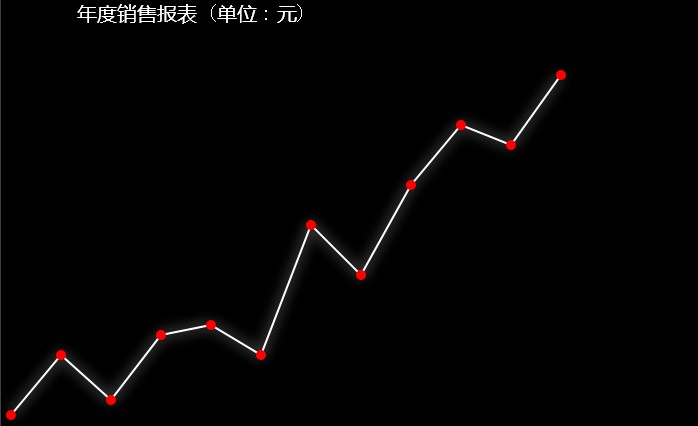
Silverlight开发历程—(绘制报表)
其本上例子是前台学习的,综合起来做一个报表。很简陋,只是体验一下绘图功能。
public partial class ChartFor2011 : UserControl
    {
        //创建 坐标集合
        private PointCollection pc = new PointCollection();

        public ChartFor2011()
        {
            InitializeComponent();
            LoadLine();
            LoadEllipse();
            BulidText();
        }
        //创建12个月文本
        private void BulidText()
        {
            for (int i = 1; i <= 12; i++)
            {
                TextBlock txb = new TextBlock()
                {
                     Text=string.Format("{0}月份",i.ToString()),
                     FontSize=18,
                     Width=40,
                     Foreground=new SolidColorBrush(Colors.White)
                };
                txb.SetValue(Canvas.LeftProperty, pc[i-1].X);
                txb.SetValue(Canvas.TopProperty, 500.00);
                canvas_month.Children.Add(txb);
            }
        }

        //使用polyline画线
        private void LoadLine()
        {
          //将集合添加到集合中
            pc.Add(new Point(10,380));
            pc.Add(new Point(60, 320));
            pc.Add(new Point(110, 365));
            pc.Add(new Point(160, 300));
            pc.Add(new Point(210, 290));
            pc.Add(new Point(260, 320));
            pc.Add(new Point(310, 190));
            pc.Add(new Point(360, 240));
            pc.Add(new Point(410, 150));
            pc.Add(new Point(460, 90));
            pc.Add(new Point(510, 110));
            pc.Add(new Point(560, 40));
            Polyline pl = new Polyline();
            pl.Stroke = new SolidColorBrush(Colors.White);
            pl.StrokeThickness = 2;
            pl.Points = pc;
            //为PolyLine添加渲染效果
            RenderEffect(ref pl);
            //将对象添加到页面UI上
            canvas_chart.Children.Add(pl);
        }

        //添加渲染效果
        private void RenderEffect(ref Polyline line)
        {
            DropShadowEffect dse = new DropShadowEffect();
            dse.BlurRadius = 30;
            dse.Opacity = 1;
            dse.ShadowDepth = 0;
            dse.Color = Colors.White;
            line.Effect = dse;
        }

        private void LoadEllipse()
        {
            int i = 1;
            foreach (Point p in pc)
            {
                //创建椭圆对象
                Ellipse ep = new Ellipse();
                ep.Width = ep.Height = 10;
                ep.Fill = new SolidColorBrush(Colors.Red);
                ep.VerticalAlignment = VerticalAlignment.Top;
                ep.HorizontalAlignment = HorizontalAlignment.Left;
                //计算椭圆位置
                double left = p.X - ep.Width / 2;
                double top = p.Y - ep.Height / 2;
                ep.Margin = new Thickness(left, top, 0, 0);
                // 添加信息
                ToolTipService.SetToolTip(ep, string.Format("这是{0}月份的数据({1})", i, p.X * p.Y));
                canvas_chart.Children.Add(ep);
                i++;
            }
        }
运行结果:


