matplotlib类
1、plt.subplot
在matplotlib下,一个Figure对象可以包含多个子图(Axes),可以使用subplot()快速绘制,其调用形式如下:subplot(numRows, numCols, plotNum)
图表的整个绘图区域被分成numRows行和numCols列,plotNum参数指定创建的Axes对象所在的区域,如何理解呢?
如果numRows = 3,numCols = 2,那整个绘制图表样式为3X2的图片区域,用坐标表示为(1,1),(1,2),(1,3),(2,1),(2,2),(2,3)。这时,当plotNum = 1时,表示的坐标为(1,3),即第一行第一列的子图;
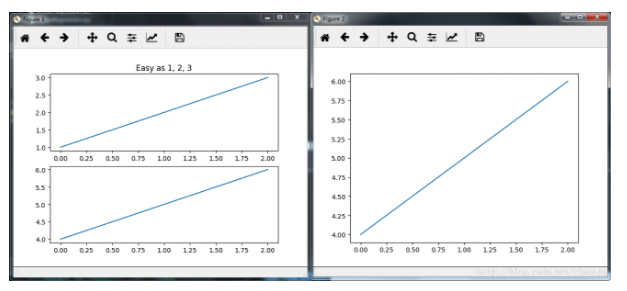
import matplotlib.pyplot as plt
plt.figure(1) # 创建第一个画板(figure)
plt.subplot(211) # 第一个画板的第一个子图
plt.plot([1, 2, 3])
plt.subplot(212) # 第二个画板的第二个子图
plt.plot([4, 5, 6])
plt.figure(2) #创建第二个画板
plt.plot([4, 5, 6]) # 默认子图命令是subplot(111)
plt.figure(1) # 调取画板1; subplot(212)仍然被调用中
plt.subplot(211) #调用subplot(211)
plt.title('Easy as 1, 2, 3') # 做出211的标题
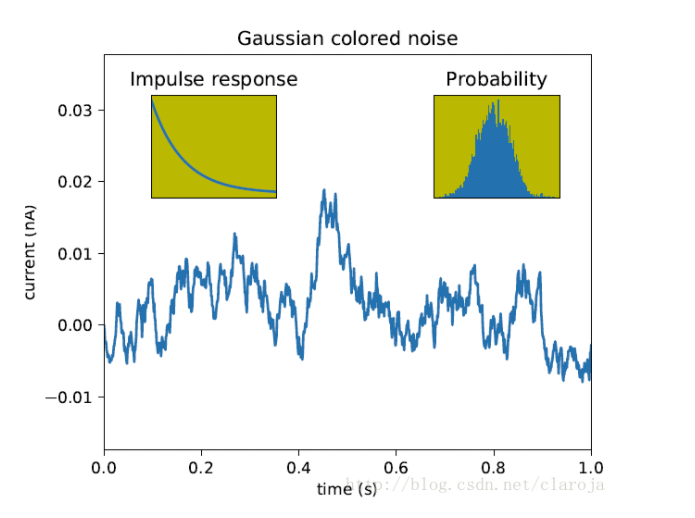
2、axes()
subplot()是将整个figure均等分割,而axes()则可以在figure上画图。
import matplotlib.pyplot as plt
import numpy as np
# 创建数据
dt = 0.001
t = np.arange(0.0, 10.0, dt)
r = np.exp(-t[:1000]/0.05) # impulse response
x = np.random.randn(len(t))
s = np.convolve(x, r)[:len(x)]*dt # colored noise
# 默认主轴图axes是subplot(111)
plt.plot(t, s)
plt.axis([0, 1, 1.1*np.amin(s), 2*np.amax(s)])
plt.xlabel('time (s)')
plt.ylabel('current (nA)')
plt.title('Gaussian colored noise')
#内嵌图
a = plt.axes([.65, .6, .2, .2], facecolor='y')
n, bins, patches = plt.hist(s, 400, normed=1)
plt.title('Probability')
plt.xticks([])
plt.yticks([])
#另外一个内嵌图
a = plt.axes([0.2, 0.6, .2, .2], facecolor='y')
plt.plot(t[:len(r)], r)
plt.title('Impulse response')
plt.xlim(0, 0.2)
plt.xticks([])
plt.yticks([])
plt.show()