python 数据分析 Matplotlib常用图表
Matplotlib绘图一般用于数据可视化
常用的图表有:
- 折线图
- 散点图/气泡图
- 条形图/柱状图
- 饼图
- 直方图
- 箱线图
- 热力图
需要学习的不只是如何绘图,更要知道什么样的数据用什么图表展示效果最好
import matplotlib.pyplot as plt
折线图
折线图用于显示随时间或有序类别的变化趋势
x = [1,2,3,4,5,6] # x轴坐标
y = [3,5,1,8,4,9] # y轴坐标

plt.plot(x, y)
[<matplotlib.lines.Line2D at 0x568fef0>]

output_3_1.png
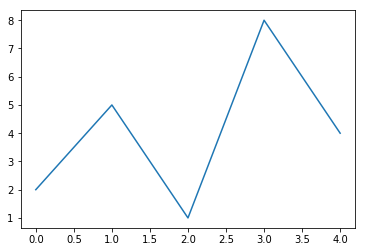
简写:只写一个轴坐标,默认y轴(x轴自增)
plt.plot([2,5,1,8,4])
[<matplotlib.lines.Line2D at 0x572a908>]
output_5_1.png
线条和标记节点样式
标记字符:标记线条中的点
线条颜色,color='g'
线条风格,linestyle='--'
线条粗细,linewidth=5.0
标记风格,marker='o'
标记颜色,markerfacecolor='b'
标记尺寸,markersize=20
透明度,alpha=0.5
线条和标记节点格式字符(详见课件)
- 如果不设置颜色,系统默认会取一个不同颜色来区别线条
- 图像打印时,黑白打印机不能区分颜色,需要风格区分
| 颜色字符 | 风格字符 | 标记字符1 | 标记字符2 |
r 红色 - 实线 o 实心圈标记 1 下花三角标记
g 绿色 -- 虚线,破折线 . 点标记 2 上花三角标记
b 蓝色 -. 点划线 , 像素标记,极小的点 3 左花三角标记
w 白色 : 点虚线,虚线 v 倒三角标记 4 右花三角标记
'' 留空或空格,无线条 ^ 上三角标记 s 实心方形标记
c 青色 > 右三角标记 p 实心五角标记
m 洋红 < 左三角标记 h 竖六边形标记
y 黄色 * 星形标记 H 横六边形标记
k 黑色 + 十字标记 D 菱形标记
x x标记 d 瘦菱形标记
#00ff00 16进制 ` ` 垂直线标记
0.8 灰度值字符串
plt.plot(
[1,2,3,4,5,6], # x轴坐标
[3,5,1,8,4,9], # y轴坐标
# 线条样式
# color='red',
# color='r',
color='#000000', # 线条颜色
linestyle='-', # 线条样式
linewidth=20, # 线条粗细

# 标记样式
marker='*', # 标记样式
markerfacecolor='r', # 标记颜色
markersize=50, # 标记大小

alpha=0.5, # 透明度
)
[<matplotlib.lines.Line2D at 0x9b351d0>]

output_7_1.png
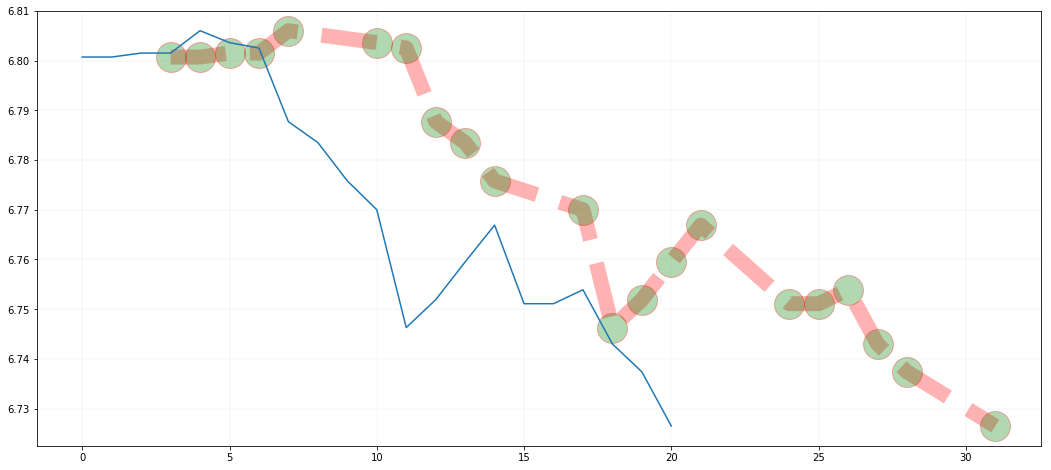
案例:绘制2017年7月国际外汇市场美元/人民币汇率走势图
时间 收盘价
2017年7月3日 6.8007
2017年7月4日 6.8007
2017年7月5日 6.8015
2017年7月6日 6.8015
2017年7月7日 6.8060
2017年7月10日 6.8036
2017年7月11日 6.8025
2017年7月12日 6.7877
2017年7月13日 6.7835
2017年7月14日 6.7758
2017年7月17日 6.7700
2017年7月18日 6.7463
2017年7月19日 6.7519
2017年7月20日 6.7595
2017年7月21日 6.7669
2017年7月24日 6.7511
2017年7月25日 6.7511
2017年7月26日 6.7539
2017年7月27日 6.7430
2017年7月28日 6.7374
2017年7月31日 6.7265
# 汇率
eurcny = [6.8007,6.8007,6.8015,6.8015,6.8060,6.8036,6.8025,6.7877,6.7835,6.7758,6.7700,6.7463,6.7519,6.7595,6.7669,6.7511,6.7511,6.7539,6.7430,6.7374,6.7265]
# 日期
date = [3,4,5,6,7,10,11,12,13,14,17,18,19,20,21,24,25,26,27,28,31]


'''
figure(num=None, figsize=None, dpi=None, facecolor=None,edgecolor=None, frameon=True)
num:图像编号或名称,数字为编号 ,字符串为名称
figsize:指定figure的宽和高,单位为英寸;1英寸等于2.5cm,A4纸是 21*30cm的纸张
dpi参数指定绘图对象的分辨率,即每英寸多少个像素,缺省值为80
facecolor:背景颜色
edgecolor:边框颜色
frameon:是否显示边框
'''
# 设置图像大
plt.figure(figsize=(18, 8))

# 折线图
plt.plot(
date,
eurcny,

color='r',
linestyle='--',
linewidth=15,

marker='o',
markersize=30,
markerfacecolor='g',

alpha=0.3,
)

plt.plot(eurcny) # x轴自增

plt.grid(linewidth=0.2, alpha=0.5) # 显示网格
output_9_0.png
散点图/气泡图
散点图作用:
- 单组数据,可以查看数据分布(不常用,最好使用直方图实现)
- 多组数据,可以插件各数据之间是否存在相关性
坐标系中,每个值用一个点(x轴,y轴确定)表示
# 数据
x = [1,3,5,7,9,11,13,15,17]
y = [2,-5,19,3,5,8,12,6,1]

plt.scatter(x, y)
<matplotlib.collections.PathCollection at 0xbe16e10>

output_11_1.png
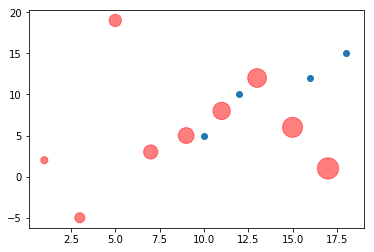
plt.scatter(
[1,3,5,7,9,11,13,15,17],
[2,-5,19,3,5,8,12,6,1],

color='r',
marker='o',
linewidth=1,
alpha=0.5,

# 点大小
# s=1000,
s=[50, 100, 150, 200, 250, 300, 350, 400, 450],
)

# 第二组散点图
plt.scatter(
[10, 12, 16, 18],
[5, 10, 12, 15],
)
<matplotlib.collections.PathCollection at 0xbc2e390>
output_12_1.png
案例:数据分析居民年龄/收入和超市销售额的对应关系
1. 背景介绍
数据:
- 顾客年龄
- 顾客年收入
- 顾客年购物金额
需求
- 分析出超市销售额和居民年龄、收入的关系
- 解释关系产生的原因
- 提出建议方案
数据
年龄 收入 销售额
34 350 123
40 450 114
37 169 135
30 189 139
44 183 117
36 80 121
32 166 133
26 120 140
32 75 133
36 40 133
# 年龄
age = [34,40,37,30,44,36,32,26,32,36]
# 收入
income = [350,450,169,189,183,80,166,120,75,40]
# 销售额
sales = [123,114,135,139,117,121,133,140,133,133]
2. 指标计算步骤,略
3. 数据可视化
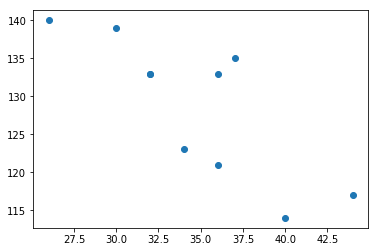
用户年龄和销售额的关系
plt.scatter(age, sales)
<matplotlib.collections.PathCollection at 0xbccd630>
output_17_1.png
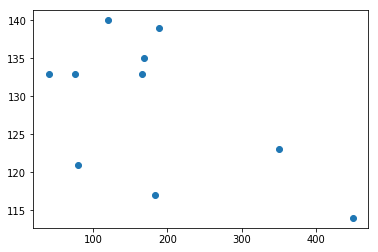
用户收入和销售额的关系
plt.scatter(income, sales)
<matplotlib.collections.PathCollection at 0xbd22e80>
output_19_1.png
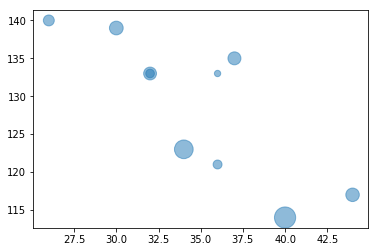
将三个维度数据画入一个图表
plt.scatter(
age,
sales,
s=income,

alpha=0.5,
)
<matplotlib.collections.PathCollection at 0xbdceeb8>
output_21_1.png
4. 结论:
- 随着用户年龄的增加,销售额逐渐降低
- 随着用户收入的增加,销售额也在降低
原因:
- 老年人的消费水平不高,只买便宜商品
- 高收入用户群体较少在本超市消费
- 本超市的主流用户群体,是发展中的年轻人,销售商品偏年轻化、平民化。
意见建议:
针对超市宣传推广营销活动的建议:
- 营销针对特定用户群体
- 年龄25-37岁之间
- 年收入20万元以下
- 应针对上述发展中的年轻人进行宣传推广活动
条形图/柱状图
- 条形图(横向)
- 柱状图(纵向)
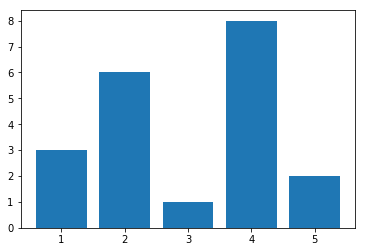
条形图和柱状图用来比较各独立类别下的单独数据的大小比较
x = [1,2,3,4,5]
y = [3,6,1,8,2]
柱状图
plt.bar(x, y)
<BarContainer object of 5 artists>
output_26_1.png
plt.bar(
x,
y,

width=0.3, # 柱子粗细

color='r',
alpha=0.3,
)

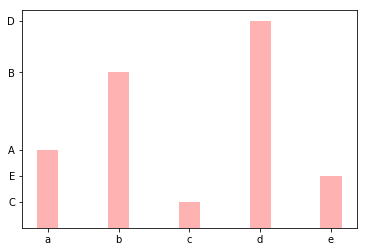
# 坐标值和坐标标注 自定义
# plt.xticks([1,3,5,6,7])
plt.xticks([1,2,3,4,5], ['a', 'b', 'c', 'd', 'e'])
plt.yticks([3,6,1,8,2], ['A', 'B', 'C', 'D', 'E'])

plt.show() # 直接显示图像,其他编辑器绘图最后必须写这行代码否则没有图
output_27_0.png
plt.bar(
x,
y,

width=0.3, # 柱子粗细

color='r',
alpha=0.3,
)

# 坐标值和坐标标注 自定义
# plt.xticks([1,3,5,6,7])
plt.xticks([1,2,3,4,5], ['a', 'b', 'c', 'd', 'e'],rotation = 90)#rotation旋转
plt.yticks([3,6,1,8,2], ['A', 'B', 'C', 'D', 'E'])

plt.show() # 直接显示图像,其他编辑器绘图最后必须写这行代码否则没有图
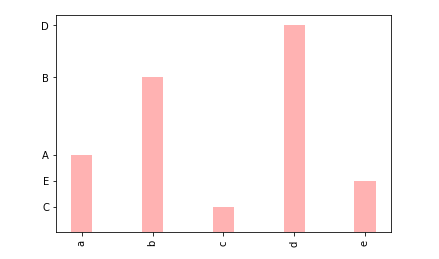
image.png
条形图
- 条形图粗细属性:height
- 条形图的x、y坐标翻转
plt.barh(x, y, height=0.5)
<BarContainer object of 5 artists>

output_29_1.png
案例:某班级男生和女生各科成绩平均分数据可视化
| 学科 | 男生 | 女生 |
| 语文 | 85.5 | 94 |
| 数学 | 91 | 82 |
| 英语 | 72 | 89.5 |
| 物理 | 59 | 62 |
| 化学 | 66 | 49 |
# 男生平均分,语文/数学/英语/物理/化学
boy = [85.5,91,72,59,66]
# 女生平均分
girl = [94,82,89.5,62,49]


# 男生成绩

# x轴,各个学科
course = [1,2,3,4,5]

plt.bar(
course,
boy,

width=0.3,
color='g',
alpha=0.3,
)


# 女生成绩

course2 = [1.3, 2.3, 3.3, 4.3, 5.3]

plt.bar(
course2,
girl,

width=0.3,
color='r',
alpha=0.3,
)


# 坐标轴和坐标轴标注
plt.xticks([1.15, 2.15, 3.15, 4.15, 5.15], ['Chi','Math','Eng','Phy','Che'])


# 了解,将数据标注在柱子上
# plt.text(3, 50, 'abcde')

for i,j in zip(course,boy):
plt.text(
i, # x轴,course学科位置
j, # y轴,boy分数
'%.1f' % j, # 数据转为一位小数
ha='center', # 水平对齐
va='bottom', # 垂直对齐
alpha = 0.5,
)

for i,j in zip(course2,girl):
plt.text(
i,
j,
'%.1f' % j,
ha='center',
va='bottom',
alpha = 0.5,
)


plt.grid(linewidth=0.1)
plt.show()
缺少一张图
output_31_0.png
饼图
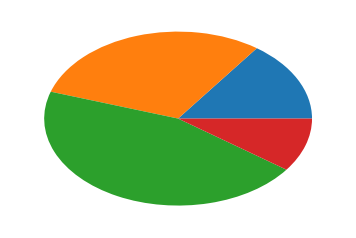
饼图用于显示各项相对总和的百分比大小
# 数据,会被饼图自动转换为百分比
p = [15,30,45,10]

plt.pie(p)
plt.show()
output_33_0.png
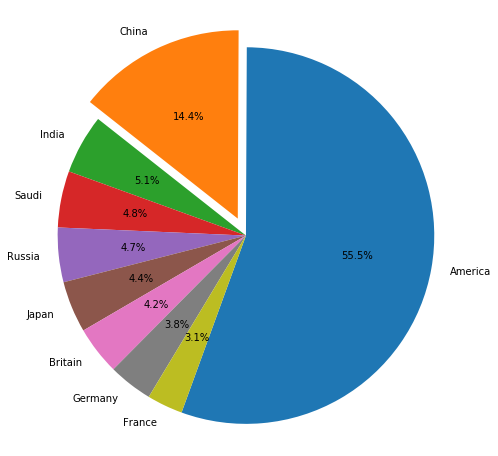
案例:2017年9国军费占比数据可视化
国家 军费占比
美国 0.5548467
中国 0.14444868
印度 0.05094268
沙特 0.04846696
俄国 0.046753
日本 0.04418206
英国 0.04161112
德国 0.03799276
法国 0.03075605
# 国名
mark = ['America','China','India','Saudi','Russia','Japan','Britain','Germany','France']
# 各国占9国总军费的比例
percent = [0.5548467,0.14444868,0.05094268,0.04846696,0.046753,0.04418206,0.04161112,0.03799276,0.03075605]

plt.figure(figsize=(8, 8))

plt.pie(
percent, # 百分比
labels = mark, # 名称
explode=(0,0.1,0,0,0,0,0,0,0), # 突出块,突出比例
autopct='%1.1f%%', # 显示百分比方式
startangle=-110, # 饼图起始的角度,度数,默认0为右侧水平180度开始,逆时针旋转
)

plt.axis('equal') # 正圆形饼图,x/y轴尺寸相等.默认是扁图
plt.show()
output_35_0.png
直方图
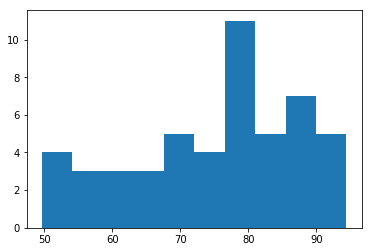
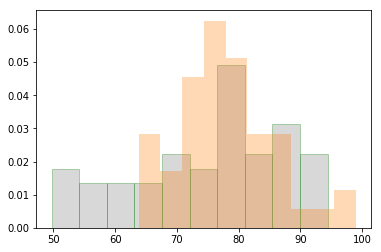
直方图是表达数据的分布情况的统计图表,一般用来表示同等区间内,某类数值出现的个数或频率(频率=出现次数/总数)
x轴表示分组数据,y轴表示分布情况
从频率分布直方图可以直观估计出:
- 众 数:频率分布直方图中最高矩形的底边中点的横坐标
- 中位数:把频率分布直方图分成两个面积相等部分的平行于Y轴的直线横坐标
直方图与柱状图的区别:
- 直方图:分区之间连续无间断,表示连续变量;值用矩形面积表示
- 条形图:各柱之间有间隙,表示孤立的、不连续分类变量;值用矩形长度表示
案例:1班和2班语文成绩统计数据可视化
# 成绩数据
h1 = [ 88.2, 83.5, 68.8, 85.4, 78.6, 69.3, 60.6, 91.2, 52.7,
85.9, 57.1, 68. , 66.6, 78.2, 78.8, 85. , 89.1, 74.4,
93.6, 75.7, 54.3, 55. , 90.9, 79.4, 94.4, 86.7, 82.4,
76.7, 78.7, 72.3, 83.9, 78.6, 80. , 70.5, 87.1, 80.3,
87.9, 65.1, 67.4, 61.5, 49.7, 77.1, 91.4, 72. , 61.5,
73.9, 76.9, 88.2, 51.2, 53.9]

h2 = [ 79.5, 99. , 80. , 71. , 79.2, 85.6, 79.2, 68.8, 68.7,
96.5, 63.8, 81.8, 76.9, 80. , 73.8, 77.1, 79.6, 76.8,
73.9, 73.2, 66. , 76.2, 76.4, 65.3, 75.2, 74.5, 87.5,
78.4, 95. , 72.6, 86. , 71.7, 71. , 87.7, 83.9, 76.8,
72.3, 67. , 67.8, 79.6, 81.9, 83. , 65.6, 91.6, 75.5,
77.6, 82.8, 87.5, 75.1, 79.4]
plt.hist(h1)
(array([ 4., 3., 3., 3., 5., 4., 11., 5., 7., 5.]),
array([49.7 , 54.17, 58.64, 63.11, 67.58, 72.05, 76.52, 80.99, 85.46,
89.93, 94.4 ]),
<a list of 10 Patch objects>)
output_39_1.png
plt.hist(
h1, # 直方图数据
10, # 直方个数
density=1, # 默认0 数据出现个数,1 出现个数归一化为出现的频率
histtype='bar', # 直方图样式:默认bar,stepfilled填充颜色,step不填充只有线条
facecolor='gray', # 直方图颜色
edgecolor = 'g', # 直方图边框颜色
alpha=0.3,
)

# 直方图叠加
plt.hist(h2, 10, density=1, histtype='bar', alpha=0.3)
(array([0.02840909, 0.01704545, 0.04545455, 0.0625 , 0.05113636,
0.02840909, 0.02840909, 0.00568182, 0.00568182, 0.01136364]),
array([63.8 , 67.32, 70.84, 74.36, 77.88, 81.4 , 84.92, 88.44, 91.96,
95.48, 99. ]),
<a list of 10 Patch objects>)
output_40_1.png
箱线图
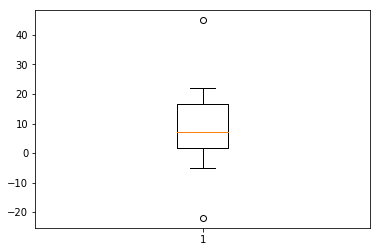
箱线图又名盒须图,是一种用作显示一组数据离散情况的统计图表,常用作多组数据的综合统计比较
四分位数:
第一四分位数(Q1),又称“较小四分位数”,等于该样本中所有数值由小到大排列后第25%的数字。
第二四分位数(Q2),又称“中位数”,等于该样本中所有数值由小到大排列后第50%的数字。
第三四分位数(Q3),又称“较大四分位数”,等于该样本中所有数值由小到大排列后第75%的数字。
箱线图主要包含5个统计量,从上到下,从高到低:
1 最大非异常值,上边线
2 Q3,箱体上边缘上四分位数
3 Q2,中位数线
4 Q1,箱体下边缘下四分位数
5 最小非异常值,下边线
6 除了上面5个统计量,上下边缘外侧可能还有异常值
Q3和Q1的差值,即四分位数差
- 大于Q3 1.5倍四分位数差的值,或者小于Q1 1.5倍四分位数差的值,划为异常值
1 a = [15,5,9,22,4,-5,45,-22]
2
3 plt.boxplot(a)
4
5 plt.show()
output_42_0.png
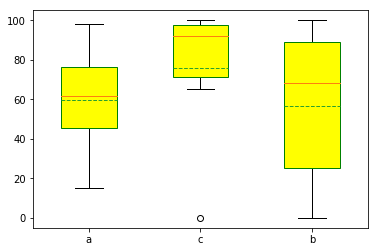
案例:某班级a/b/c三组学员数学成绩统计分析可视化
1 组别\编号 1 2 3 4 5 6 7 8
2 a 42 55 79 68 15 98
3 b 32 59 77 100 92 88 5 0
4 c 92 98 78 65 97 100 0
a = [42,55,79,68,15,98]
b = [32,59,77,100,92,88,5,0]
c = [92,98,78,65,97,100,0]

plt.boxplot(
(a, c, b),
labels = ('a','c','b'), # 标签

showfliers = True, # 是否显示异常值,默认显示
whis = 1.5, # 指定异常值参数:默认1.5倍四分位差
showmeans = True, # 是否显示平均值,默认不显示
meanline = True, # 是否用线标示平均值,默认用点

widths = 0.5, # 柱子宽度

# vert = False, # 默认True纵向,False横向
patch_artist = True, # 是否填充颜色
boxprops = {'facecolor':'#ffff00','color':'green'}, # 箱体样式
)

plt.show()
output_44_0.png
众数、平均数,中位数的区别
- 众数:出现频率最高的数,没什么用
- 平均数:
- 对极端值非常敏感
- 中位数:
- 对极端值不敏感
总结:
比赛打分之所以使用平均数,利用平均值的敏感(中位数会出现大量的相同分数),
同时为了降低平均值的敏感程度,去掉最高分和最低分
import numpy as np
1 a = [1,2,3,4,5,6,7,8,9,10,11]
2
3 # 平均值,中位数
4 np.mean(a), np.median(a)
(6.0, 6.0)
1 a = [1,2,3,4,5,6,7,8,9,10,11,1000]
2
3 # 平均值,中位数
4 np.mean(a), np.median(a)
(88.83333333333333, 6.5)
热力图
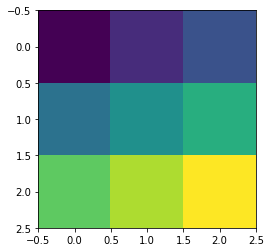
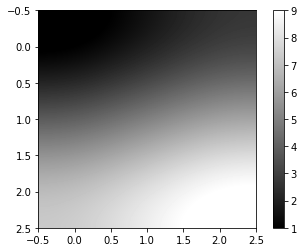
热力图以二维形式展示数据的大小,主要用于数据的重要程度/相关度展示
1 a = [
2 [1, 2, 3],
3 [4, 5, 6],
4 [7, 8, 9]
5 ]
6
7 plt.imshow(a)
<matplotlib.image.AxesImage at 0x13a29f28>
output_50_1.png
1 plt.imshow(
2 a, # 数据
3 cmap='gray', # 配色,gray灰度
4 # origin='lower', # 水平翻转,默认upper,lower
5 interpolation='lanczos', # 渲染,模糊
6 )
7
8 plt.colorbar() #侧栏
<matplotlib.colorbar.Colorbar at 0x110f9278>
output_51_1.png
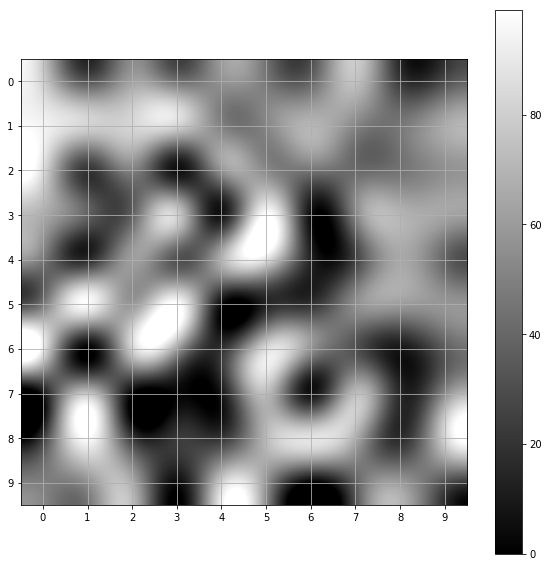
例子:可视化班级同学成绩和座位关系
1 import numpy as np
2
3 a = np.random.randint(0, 100, (10, 10))
4 a
 1 array([[80, 32, 62, 43, 57, 46, 39, 75, 21, 29],
 2 [94, 82, 83, 83, 50, 52, 70, 52, 46, 66],
 3 [86, 21, 50, 6, 58, 53, 46, 41, 45, 56],
 4 [67, 38, 38, 80, 8, 99, 5, 52, 70, 64],
 5 [47, 16, 61, 32, 69, 88, 13, 26, 65, 39],
 6 [46, 97, 59, 99, 4, 14, 19, 55, 61, 58],
 7 [91, 0, 82, 62, 19, 85, 57, 31, 9, 36],
 8 [ 9, 75, 2, 2, 9, 73, 7, 73, 15, 54],
 9 [23, 98, 22, 22, 21, 72, 88, 67, 17, 83],
10 [49, 56, 66, 5, 81, 57, 0, 38, 60, 31]])
 1 plt.figure(figsize=(10, 10))
 2
 3 plt.imshow(
 4 a, # 数据
 5 cmap='gray', # 配色,gray灰度
 6 interpolation='lanczos', # 渲染,模糊
 7 )
 8
 9 plt.xticks([0,1,2,3,4,5,6,7,8,9])
10 plt.yticks([0,1,2,3,4,5,6,7,8,9])
11
12 plt.grid()
13 plt.colorbar() #侧栏
<matplotlib.colorbar.Colorbar at 0x11044668>
output_54_1.png
叠加图像到背景上
 1 # 灰度图像
 2 [
 3 [3,50,2,4],
 4 [45,22,3,4],
 5 [1,2,3,4],
 6 ]
 7
 8 # 彩色图像
 9 [
10 [[255, 0, 255],[255, 0, 255],[255, 0, 255],[255, 0, 255]],
11 [[255, 0, 255],[255, 0, 255],[255, 0, 255],[255, 0, 255]],
12 [[255, 0, 255],[255, 0, 255],[255, 0, 255],[255, 0, 255]],
13 ]
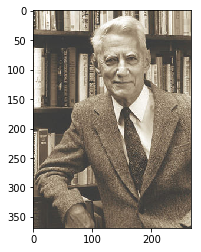
1 img = plt.imread('images/xiangnong.jpg') # 将图像转为数组
2 img
 1 array([[[140, 122, 100],
 2 [103, 90, 74],
 3 [ 88, 78, 69],
 4 ...,
 5 [211, 199, 175],
 6 [181, 169, 145],
 7 [178, 164, 138]],
 8
 9 [[118, 102, 79],
10 [112, 100, 86],
11 [ 82, 73, 64],
12 ...,
13 [204, 192, 168],
14 [177, 165, 141],
15 [176, 162, 136]],
16
17 [[248, 233, 212],
18 [215, 208, 192],
19 [126, 122, 111],
20 ...,
21 [216, 204, 180],
22 [194, 182, 158],
23 [196, 182, 156]],
24
25 ...,
26
27 [[ 86, 76, 66],
28 [ 84, 74, 65],
29 [ 82, 73, 64],
30 ...,
31 [ 96, 88, 77],
32 [ 84, 76, 65],
33 [ 72, 66, 54]],
34
35 [[ 88, 79, 70],
36 [ 87, 78, 69],
37 [ 91, 84, 76],
38 ...,
39 [ 63, 64, 59],
40 [ 59, 60, 55],
41 [ 71, 71, 69]],
42
43 [[ 93, 79, 68],
44 [103, 89, 78],
45 [ 94, 80, 69],
46 ...,
47 [ 66, 65, 61],
48 [ 68, 67, 62],
49 [ 72, 69, 64]]], dtype=uint8)
plt.imshow(img)
<matplotlib.image.AxesImage at 0x10c3b898>
output_57_1.png
 1 extent = (0, 25, 0, 25) # 按 左右下上 位置拉伸填充图像
 2 plt.imshow(img, extent=extent)
 3
 4 # 将新图叠加到上图之上
 5 plt.scatter(
 6 [12.5, 15.5],
 7 [19, 19.5],
 8 s=[100, 200],
 9 color='r',
10 alpha=0.7,
11 )
12
13 plt.axis("off") # 去掉坐标轴
(0.0, 25.0, 0.0, 25.0)

output_58_1.png


【推荐】国内首个AI IDE,深度理解中文开发场景,立即下载体验Trae
【推荐】编程新体验,更懂你的AI,立即体验豆包MarsCode编程助手
【推荐】抖音旗下AI助手豆包,你的智能百科全书,全免费不限次数
【推荐】轻量又高性能的 SSH 工具 IShell:AI 加持,快人一步
· 基于Microsoft.Extensions.AI核心库实现RAG应用
· Linux系列:如何用heaptrack跟踪.NET程序的非托管内存泄露
· 开发者必知的日志记录最佳实践
· SQL Server 2025 AI相关能力初探
· Linux系列:如何用 C#调用 C方法造成内存泄露
· 无需6万激活码!GitHub神秘组织3小时极速复刻Manus,手把手教你使用OpenManus搭建本
· Manus爆火,是硬核还是营销?
· 终于写完轮子一部分:tcp代理 了,记录一下
· 别再用vector<bool>了!Google高级工程师:这可能是STL最大的设计失误
· 单元测试从入门到精通