信管专业对口工作岗位薪资 数据统计与可视化案例(爬虫+数据预处理+数据可视化)
案例简介:
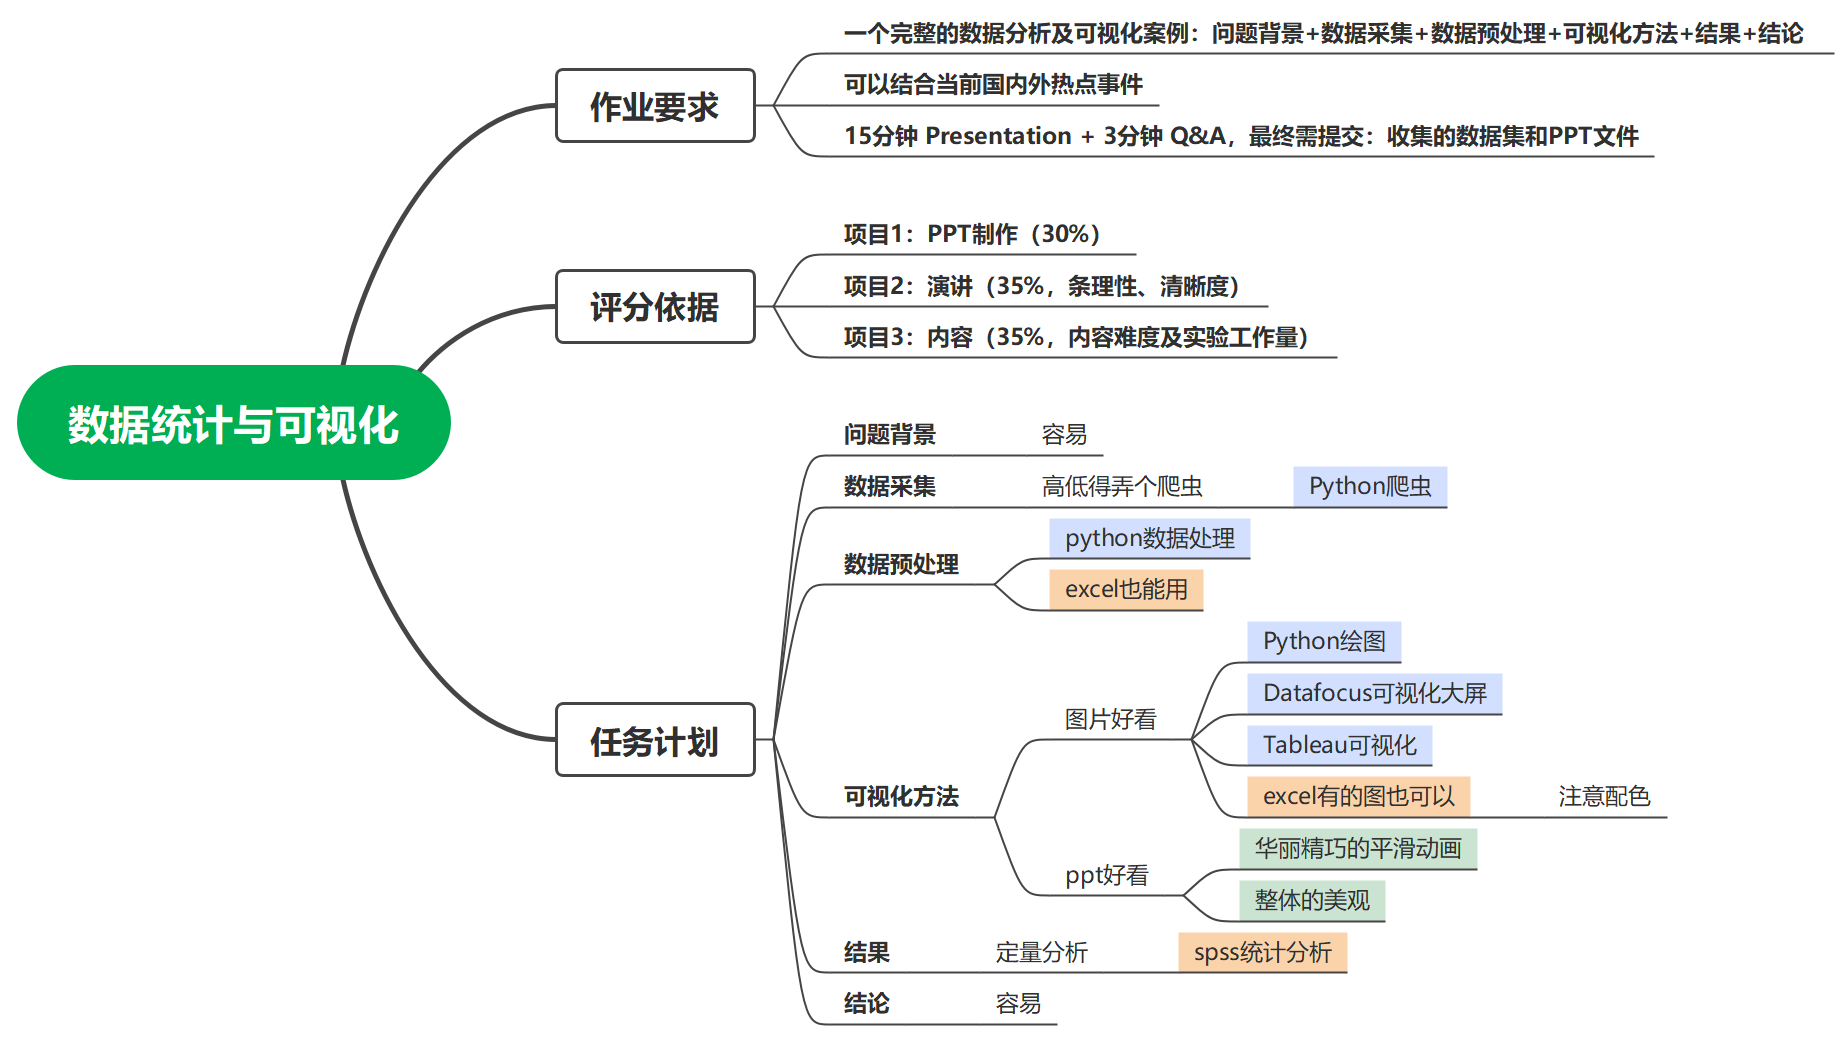
本项目是一个针对数据统计与可视化课程的Presentation大作业项目
1.数据采集
智联招聘爬虫,截止于2022.12.15可正常使用。
爬取网站(可以先自己搜一下关键词看看是否充足):https://m.zhaopin.com/sou/positionlist
岗位关键词可以参照:https://www.zhaopin.com/jobs
直接上完整代码
1.1导包
import requests
import time
import random
import json
import pandas as pd
import matplotlib.pyplot as plt
1.2爬虫代码
爬虫按照面向对象的方式编写,定义一个spider类可以完成关键词检索、下载html、动态请求、请求头代理池、清洗解析json数据,保存字典为csv文件。如果某一部分代码执行失败并不一定需要完全重跑代码,跟面向过程一样,可以直接调用spider对象相应的方法(函数)继续运行。
# 爬取的页数,爬取前三页,更多爬取需要cookie
page_num_max = 3

class Recruitment_info():
    """以智联招聘爬取全国各地相应职业招聘信息"""
    def __init__(self):
        # 智联招聘搜索网址,跳过登录
        self.zhilian_url = 'https://m.zhaopin.com/api/sou/positionlist'

    def get_page(self,search_content,page_num):
        """获取网址,返回对应html。该网页是post请求"""
        # 拼接网址,自定义搜索内容
        url = self.zhilian_url
        headers = {'user-agent':self.get_ua()}
        data = self.get_data(search_content,page_num)
        html = requests.post(url=url,headers=headers,data=data).text
        # 调试
        # print(f"get_page successful,url:{url} \n html:{html}")
        return html

        # 根据断点,找到加密方式。
    def get_data(self,search_content,page_num):
        """生成动态的Request Payload信息"""
        t = "0123456789abide"
        d = 'XXXXXXXX-XXXX-4XXX-XXXX-XXXXXXXXXXXX'
        for i in range(35):
            t_rd = random.choice(t)
            d = d.replace('X', t_rd, 1)
        data = {
            'S_SOU_FULL_INDEX': search_content,
            'S_SOU_WORK_CITY': "489",
            'at': "",
            'channel': "baidupcpz",
            'd': d,  # 每次请求都会变,动态加载。
            'eventScenario': "msiteSeoSearchSouList",
            'pageIndex': page_num,
            'pageSize': 20,
            'platform': 7,
            'rt': "",
            'utmsource': "baidupcpz",
        }
        return json.dumps(data)

    def get_ua(self):
        """user-agent池,返回随机ua"""
        ua_list = ['Mozilla/5.0 (compatible; MSIE 9.0; Windows NT 6.1; Win64; x64; Trident/5.0; .NET CLR 2.0.50727; SLCC2; .NET CLR 3.5.30729; .NET CLR 3.0.30729; Media Center PC 6.0; InfoPath.3; .NET4.0C; Tablet PC 2.0; .NET4.0E)',
        'Mozilla/4.0 (compatible; MSIE 8.0; Windows NT 6.1; WOW64; Trident/4.0; SLCC2; .NET CLR 2.0.50727; .NET CLR 3.5.30729; .NET CLR 3.0.30729; Media Center PC 6.0; .NET4.0C; InfoPath.3)',
        'Mozilla/5.0 (Windows NT 6.1; WOW64; rv:6.0) Gecko/20100101 Firefox/6.0',
        'Mozilla/5.0 (compatible; MSIE 9.0; Windows NT 6.1; WOW64; Trident/5.0; SLCC2; .NET CLR 2.0.50727; .NET CLR 3.5.30729; .NET CLR 3.0.30729; Media Center PC 6.0; InfoPath.3; .NET4.0C; .NET4.0E)',
        'Mozilla/5.0 (Linux; Android 6.0; Nexus 5 Build/MRA58N) AppleWebKit/537.36 (KHTML, like Gecko) Chrome/92.0.4515.131 Mobile Safari/537.36']
        return random.choice(ua_list)

    def Data_cleaning(self,html,content):
        '''将收集到的js数据进行清洗'''
        resurt = json.loads(html)
        resurt = resurt['data']['list']
        data_list = []
        for per_info in resurt:
            data = {
                # 'cityDistrict' : per_info['cityDistrict'], # city 城市
                'searchkeyword':content,
                'cityId' : per_info['cityId'], # cityid 城市id
                'companyId' : per_info['companyId'], # companyId 公司id
                'companyName' : per_info['companyName'], # 'companyName' 公司名称
                'companySize' : per_info['companySize'], # 公司大小
                'education' : per_info['education'], # 'education' 教育
                'workName' : per_info['name'], # 'name' 公司性质
                'publishTime' : per_info['publishTime'], # 'publishTime' 发布时间
                'salary' : per_info['salary60'], # 'salary60' 薪资
                'welfareLabel' : per_info['welfareLabel'], # 'welfareLabel' 工作福利
                'workCity' : per_info['workCity'], # 'workCity' 工作地点(省)
                'workingExp' : per_info['workingExp'] # 工作经验
            }
            data_list.append(data)
        return data_list

    def salve_data_csv(self,df):
        """将数据保存至本地的CSV"""
        df.to_csv(path_or_buf='./数据.csv', encoding='GB18030')

    def run(self,*search_content):
        """控制整个代码运行"""
        # 收集3页数据
        data_list = []
        for content in search_content:
            print('正在爬取',content)
            for num in range(page_num_max):
                # 获取网页源码
                print('正在爬取第%d页'%(num+1))
                html = self.get_page(content,num+1)
                # 数据清洗
                data_list.extend(self.Data_cleaning(html,content))
                time.sleep(random.random()*5) # 休息时间

            # 生成dataframe方便后续数据操作
        else:
            df = pd.DataFrame(data_list)
            self.salve_data_csv(df)
            return df
1.3运行爬虫
我们通过自身现有知识和从知乎等平台获取到的建议,整理了如下信管专业对口职业岗位用于爬取相应招聘信息。
# 爬虫和初步清洗
spider = Recruitment_info()#spider作为一个实例化对象
df = spider.run(
    '数据分析','数据标注','数据采集','数据开发','数据挖掘','大数据开发',
    '区块链开发','智能合约','区块链','nft数字藏品','元宇宙',
    '系统分析','信息系统','系统分析师','系统分析员','信息系统设计',
    '产品经理','互联网产品经理','产品主管','产品专员','产品助理',
    '前端','web','后端','开发','Android','安卓','java','python','Go开发','小程序',
    '视觉算法','图像算法','自然语言处理','nlp','算法工程师','Ai','深度学习',
    '电商客服','电商运营','电商经理','电商主管','电商专员','电商助理',
    '量化交易','量化投资',
    'ERP实施顾问','ERP运维工程师','ERP渠道经理','ERP实施工程师','档案管理','企业管理咨询','信息管理员',
    '网络运营专员','网络运营助理网站编辑','SEO优化','网络营销','网络编辑','数字营销','新媒体营销',
    'IT质量管理','QA经理','QA主管','质量管理','系统测试','软件测试',
    '配置管理员','信息工程师','故障分析员','IT运维','IT维护经理','IT技术支持','IT维护人员',
    '信息技术经理','信息技术主管','信息技术专员','系统工程师','系统管理员','网络工程师',
    '网络管理员','数据库管理','DBA','实施顾问','IT文员','IT助理','文档工程师','算法工程师',
    'IT管理','首席技术官','CIO','IT总监','IT研发总监','研发经理','研发主管','IT项目技术总监','IT高级项目经理','IT高级项目主管','IT主管'
               )
这个代码运行起来的结果是这样的:

爬虫参考文献(我的代码略有改动,修复了编码可能存在的错误和增加了搜索关键词到数据表。):爬取招聘信息并进行数据分析及可视化_小翔努力变强的博客-CSDN博客
2.数据预处理
数据预处理部分需要采用python完成,主要分为两部分,一是数据清洗,二是特征工程。
2.1数据清洗
首先还是导入相应的库
import pandas as pd
import numpy as np
import matplotlib.pyplot as plt
import seaborn as sns
%matplotlib inline
我已经将之前的数据.csv文件通过excel转化为了爬虫汇总.xlsx
data=pd.read_excel('汇总爬虫.xlsx',index_col=0)
data
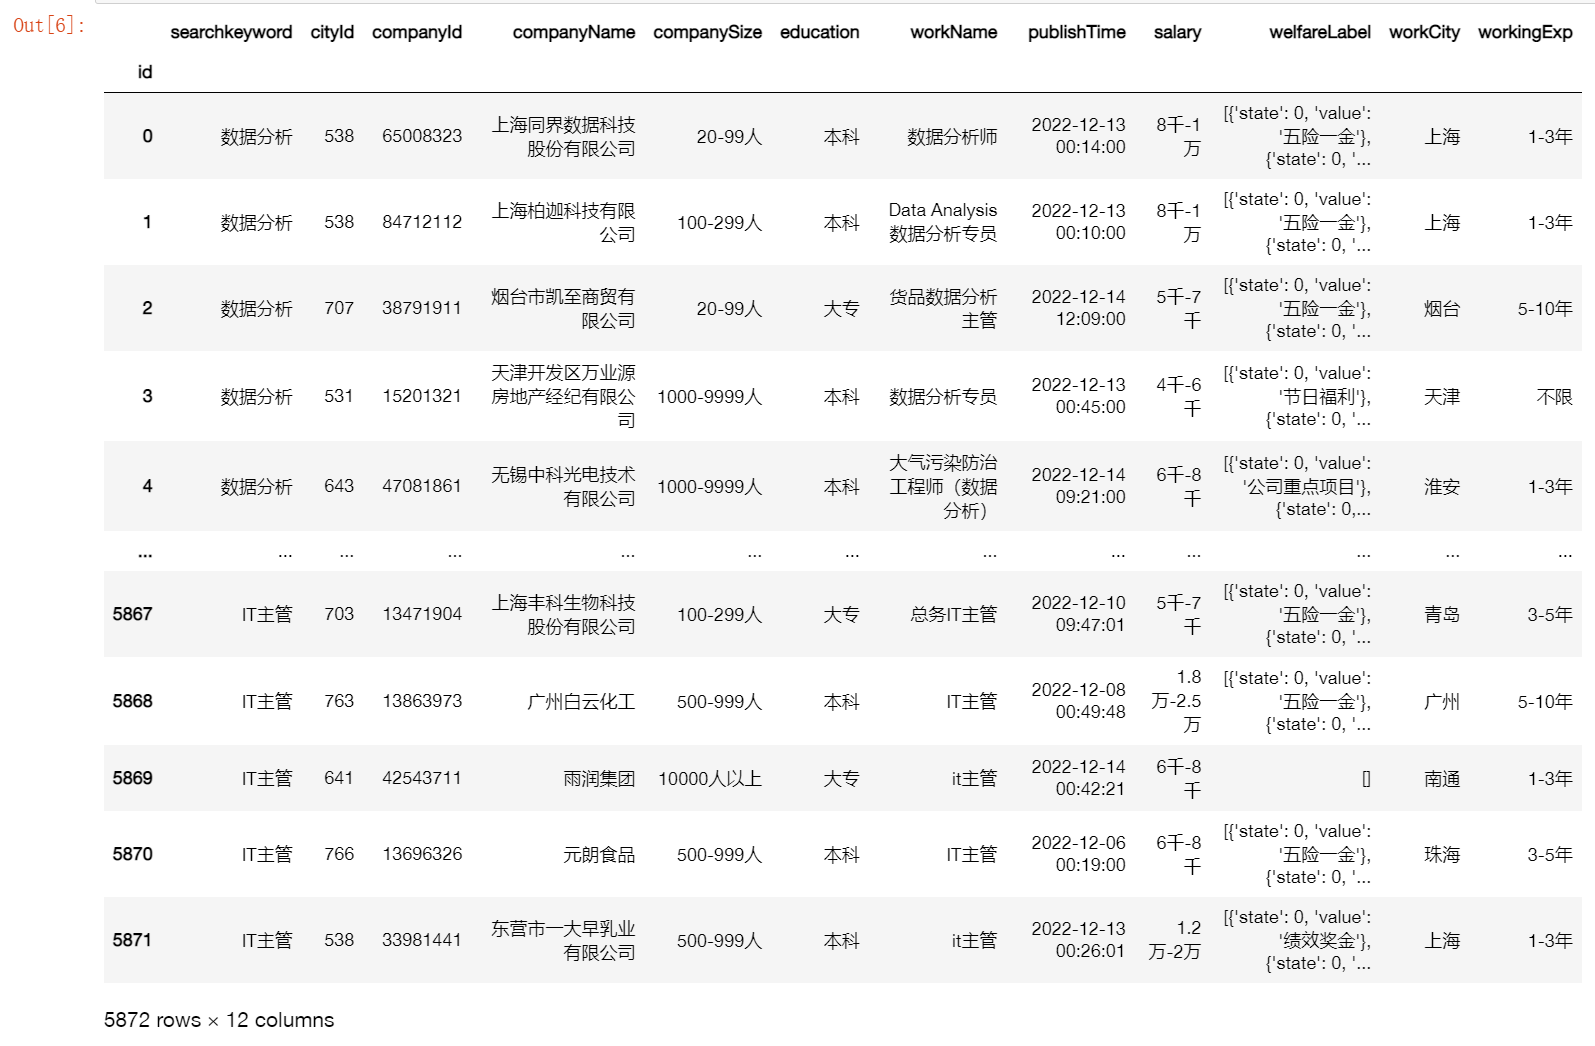
接下来我们着手数据清洗
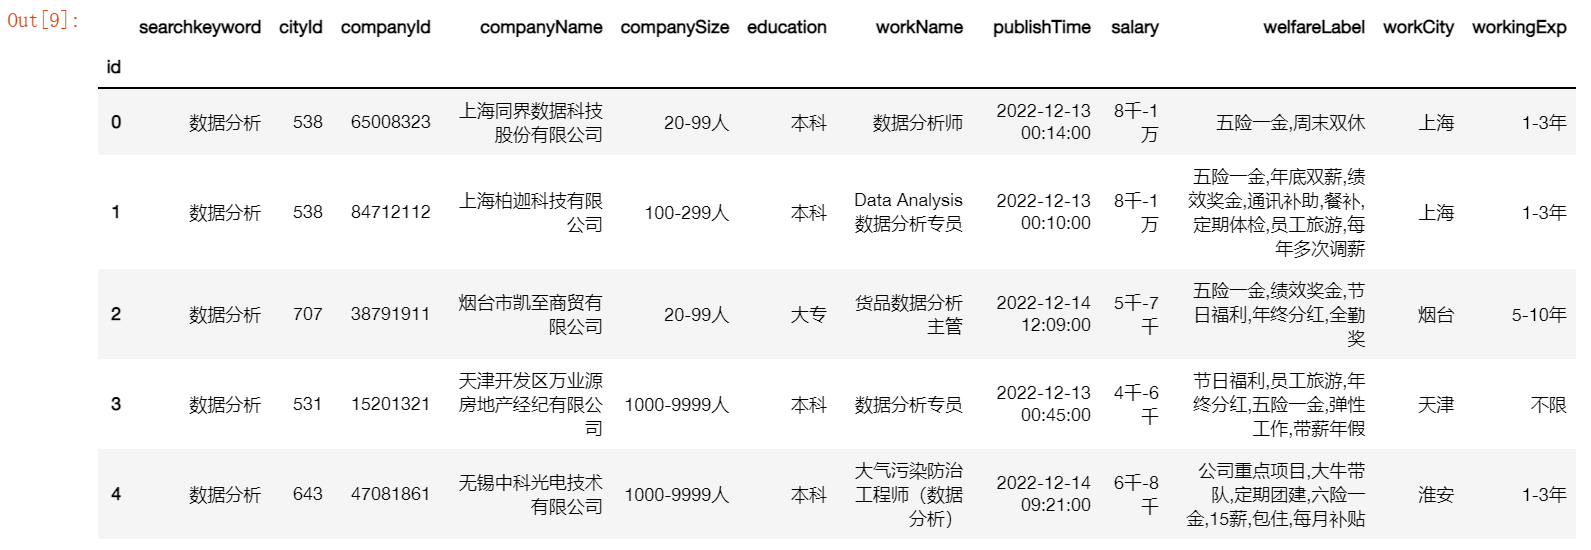
2.1.1将welfareLabel转换为列表
由于爬虫没有做json列表转字符串的操作就保存为了csv文件,这里我们将其中的福利描述保存为以逗号分隔的字符串形式的列表,以便于之后做词频统计时更加方便的读取。
import ast
def str2list(cell):#将字符串解析成列表字典、然后提取保存为字符串
    String=[]
    List=ast.literal_eval(cell)#从字符串读取列表
    for i in range(len(List)):
        element=List[i]['value']#列表嵌套字典
        String.append(element)
    string= ",".join(String)#列表——>字符串
    return string
data['welfareLabel']=data['welfareLabel'].astype(str).apply(str2list)
data.head()
2.2.2 从salary提取工资上下限
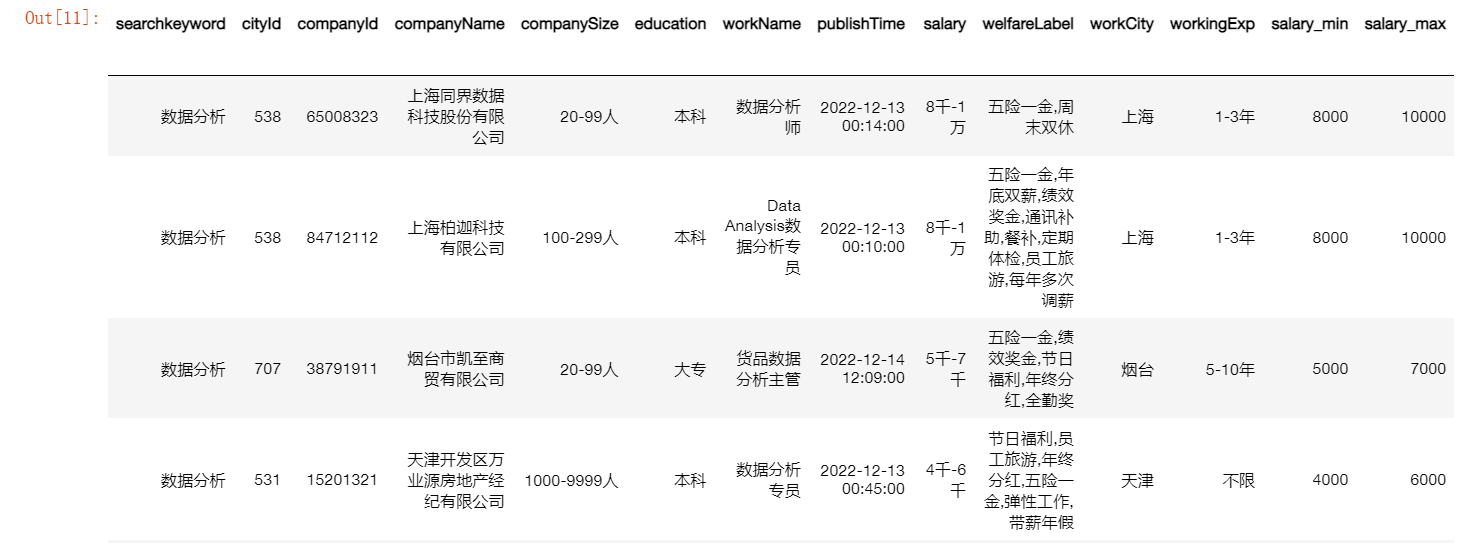
以字符串形式存在的薪资数据是毫无意义的,这里我们需要自定义函数来涵括尽可能多的情况,将薪资区间保存为最小值和最大值两列。
def range2min(text):
    if '千' in text:
        text=text.replace('千','000')#替换中文为数字
    if '万' in text:
        if '.' in text:
            text=text.replace('.','')
            text=text.replace('万','000')
        else:
            text=text.replace('万','0000')
    if '元' in text:
        text=text.replace('元','')
    if '/月' in text:#把月转换
        text=text.replace('/月','')
    if '/天' in text:#把天转换
        text=int(text.split('-')[0])*21.75#日薪转换为月薪
    else:
        text=text.split('-')[0]
    return str(text)#提取-特定字符之前的数字
def range2max(text):
    if '千' in text:
        text=text.replace('千','000')
    if '元' in text:
        text=text.replace('元','')
    if '/月' in text:#把月转换
        text=text.replace('/月','')
    if len(text.split('-'))>1:#判断确实是区间、
        if '万' in text:
            if '.' in text.split('-')[1]:
                text=text.replace('.','')
                text=text.replace('万','000')
            else:
                text=text.replace('万','0000')
        if '/天' in text:
            text=text.replace('/天','')
            text=int(text.split('-')[1])*21.75
        else:
            text=text.split('-')[1]
        return str(text)#提取-特定字符之后的数字
    else:
        return text.split('-')[0]
将上方函数应用到dataframe对应的列(添加了新的两列)
data['salary_min']=data['salary'].astype(str).apply(range2min)#对列应用自定义函数
data['salary_max']=data['salary'].astype(str).apply(range2max)
data
此后我们再来观察一下数据格式
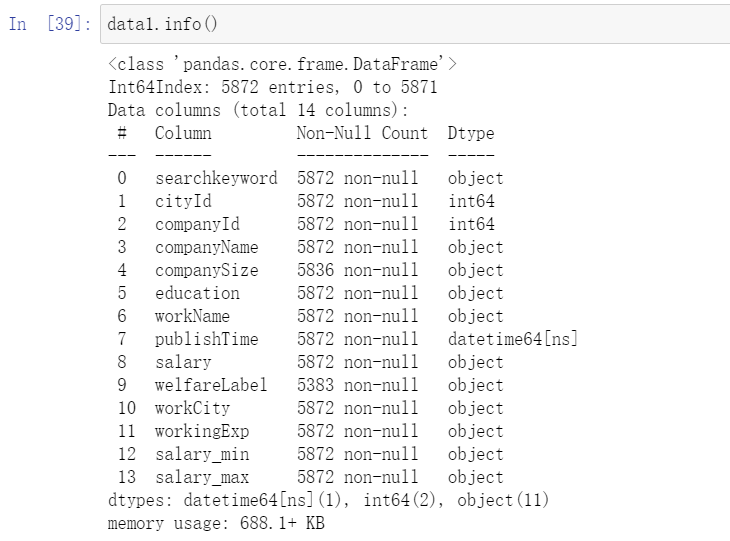
data['workingExp'].describe()
data['companySize'].describe()

data.to_excel('数据清洗后信管对口岗位薪资数据.xlsx')
data1=pd.read_excel('数据清洗后信管对口岗位薪资数据.xlsx',index_col=0)
data1
将薪资转换为数字,其他字符设为0
data1['salary_min']=pd.to_numeric(data1['salary_min'], errors='coerce').fillna(0)
data1['salary_max']=pd.to_numeric(data1['salary_max'], errors='coerce').fillna(0)
data1
再次查看数据类型:
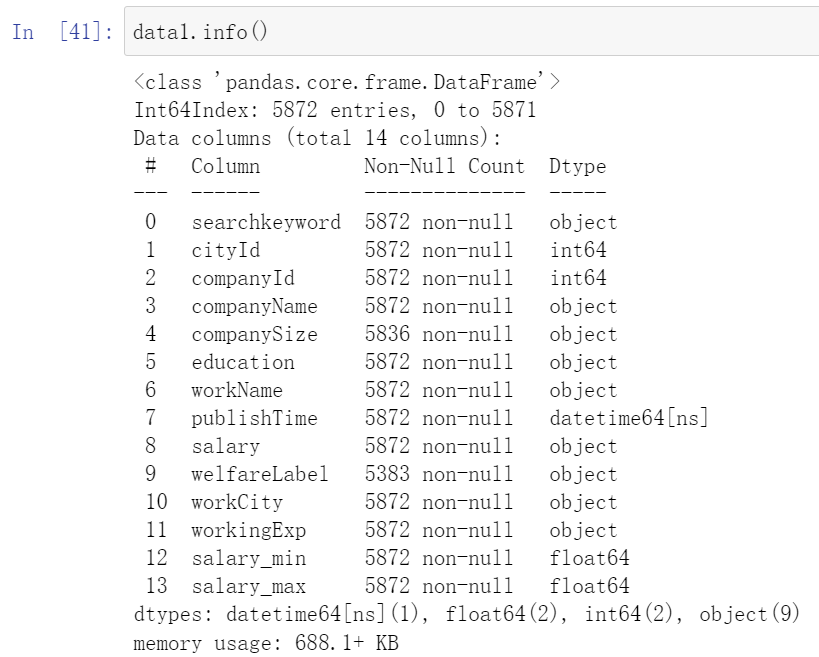
导出文件数据清洗后的excel文件
data1.to_excel('数据清洗后信管对口岗位薪资数据(数字).xlsx')
2.2特征编码
2.2.1将companySize转化为定序数据
查看数据类别数
list(data1.companySize.unique())
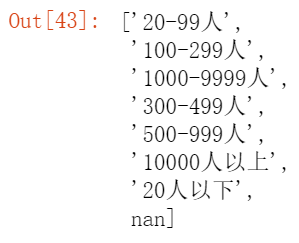
通过定义新旧两个列表来完成定序数据的替换,直接调用标签编码会导致顺序不对。
data1.companySize=data1.companySize.fillna(0)
origin_companySize=['20人以下', '20-99人', '100-299人', '300-499人', '500-999人', '1000-9999人', '10000人以上','0']
new_companySize=[10,60,200,400,750,5500,20000,0]
def labelcompanySize(cell):
    for i in range(len(origin_companySize)):
        if cell==origin_companySize[i]:
            cell=new_companySize[i]
    return cell
data1['companySize']=data1['companySize'].astype(str).apply(labelcompanySize)
data1
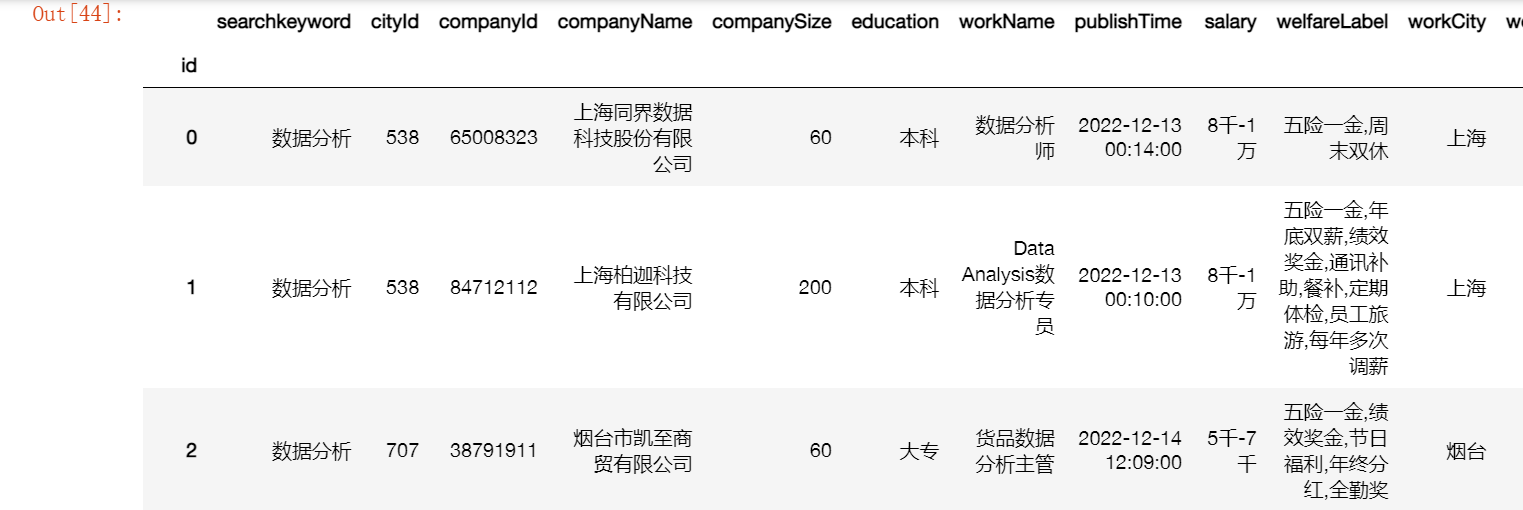
相似的,对教育水平和工作经验做类似的处理
2.2.2将education转化为定序数据
list(data1.education.unique())
origin_education=['学历不限','中专/中技','高中','大专','本科','硕士','博士']
new_education=[0,1,2,3,4,5,6]
def labeleducation(cell):
    for i in range(len(origin_education)):
        if cell==origin_education[i]:
            cell=new_education[i]
    return cell
data1['education']=data1['education'].astype(str).apply(labeleducation)
data1
2.2.3将workingExp转化为定序数据
origin_workingExp=[ '不限','无经验','1年以下','1-3年', '3-5年','5-10年','10年以上']
new_workingExp=[0,1,2,3,4,5,6]
def labelworkingExp(cell):
    for i in range(len(origin_workingExp)):
        if cell==origin_workingExp[i]:
            cell=new_workingExp[i]
    return cell
data1['workingExp']=data1['workingExp'].astype(str).apply(labelworkingExp)
data1
最后保存数据为后续分析的基本数据
data1.to_excel('特征工程后信管对口岗位薪资数据.xlsx')
data1.info()
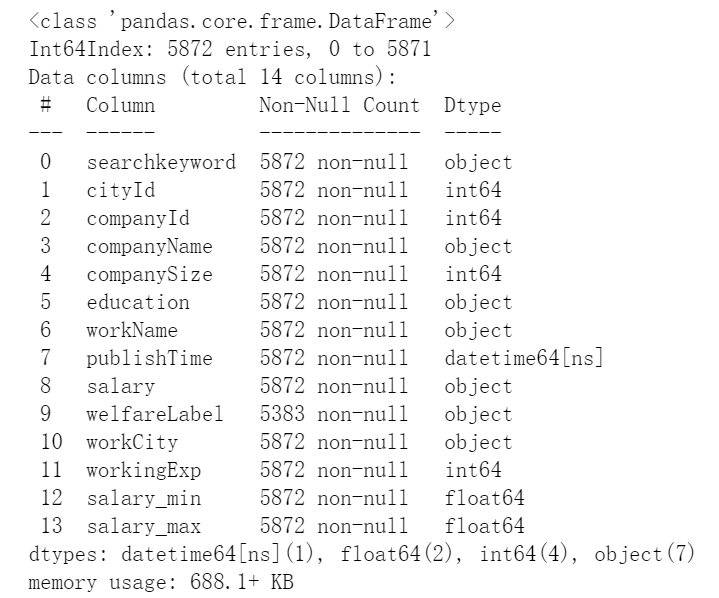
数据预处理后的数据:
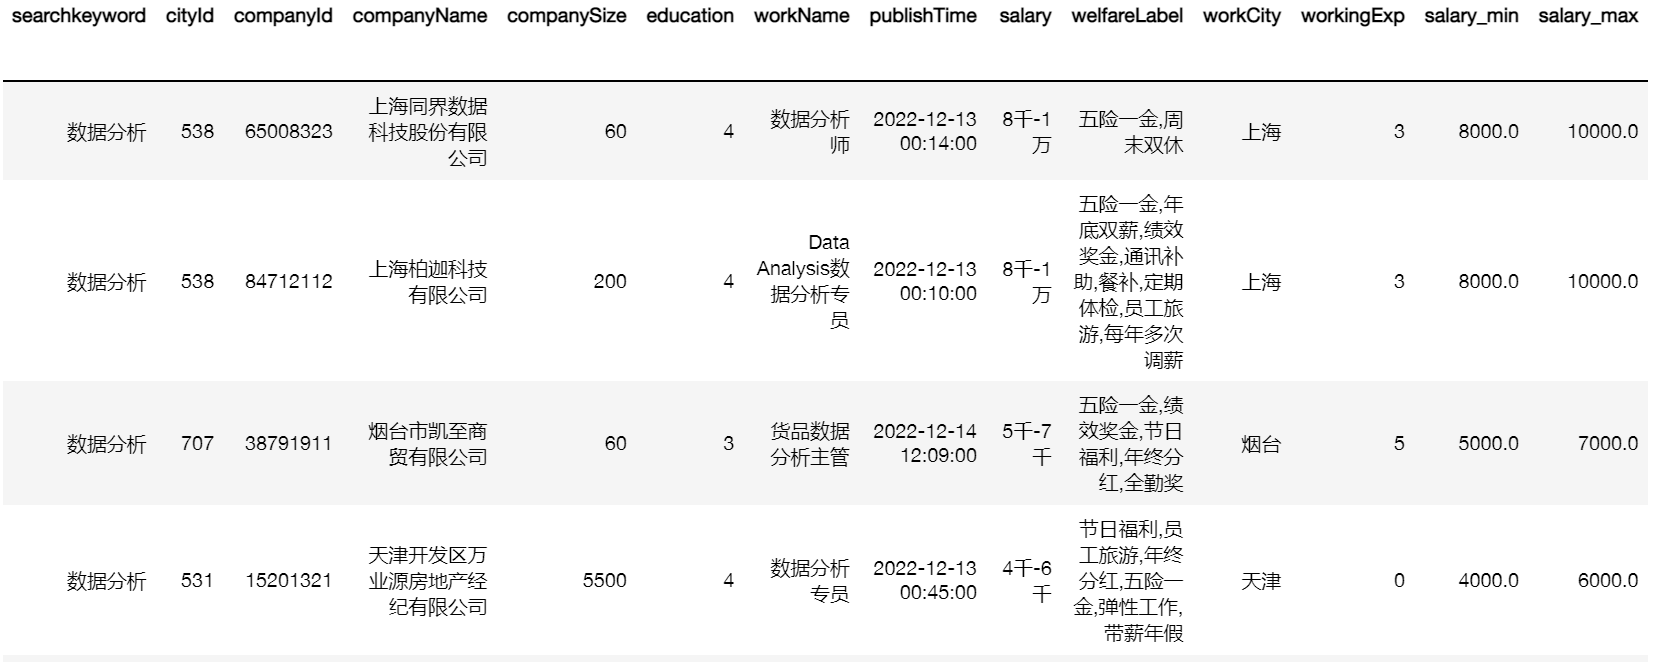
如果想要获取这份数据可以在这里下载:信管对口工作岗位数据.xlsx - 飞桨AI Studio (baidu.com)
3.数据可视化
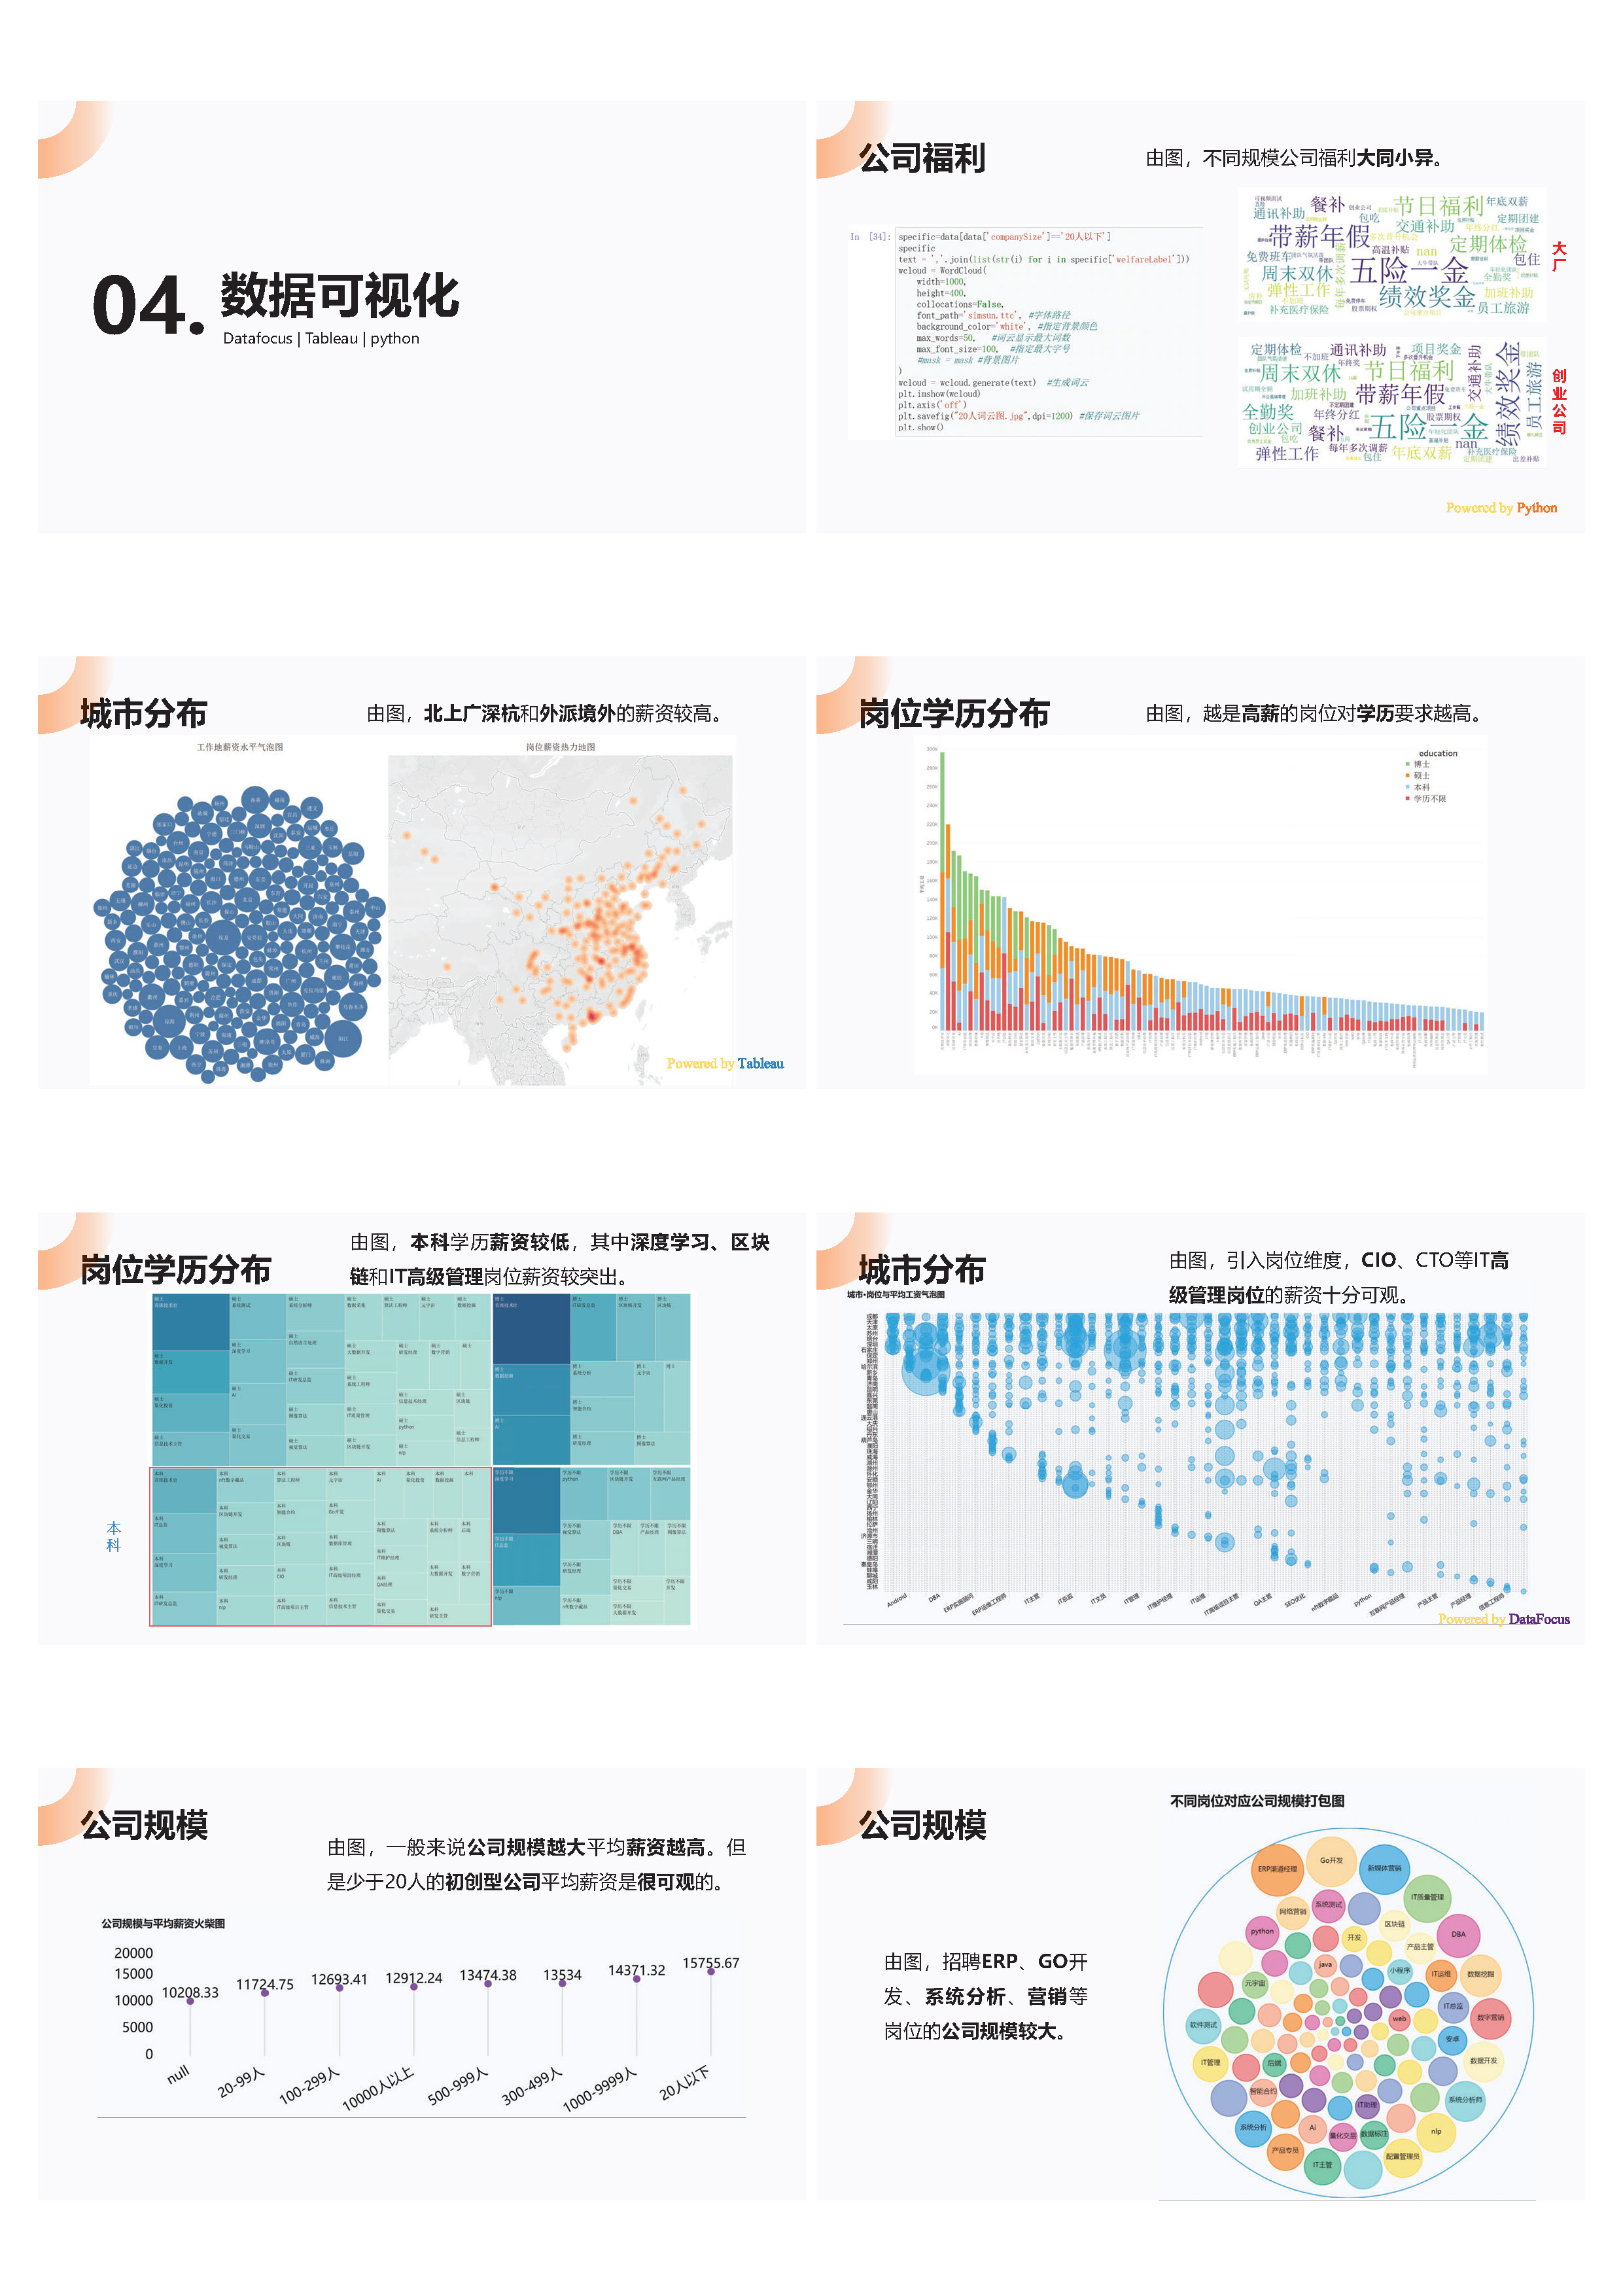
常用的数据可视化软件有excel、python、Tableau、DataFocus、PowerBI
我比较喜欢的使用的是python、Tableau、DataFocus
3.1 python词云图
针对之前处理的公司福利字符数据做词频统计然后做词云图
import pandas as pd
import numpy as np
import matplotlib.pyplot as plt
import seaborn as sns
%matplotlib inline
data=pd.read_excel('信管对口工作岗位数据(未标签编码).xlsx',index_col=0)
specific=data[data['companySize']=='10000人以上']
specific
text = ','.join(list(str(i) for i in specific['welfareLabel']))
wcloud = WordCloud(
    width=1000,
    height=400,
    collocations=False,
    font_path='simsun.ttc', #字体路径
    background_color='white', #指定背景颜色
    max_words=50,   #词云显示最大词数
    max_font_size=100,  #指定最大字号
    #mask = mask #背景图片
)
wcloud = wcloud.generate(text)  #生成词云
plt.imshow(wcloud)
plt.axis('off')
plt.savefig("10000人以上词云图.jpg",dpi=1200) #保存词云图片
plt.show()

3.2 Tableau气泡图、热力地图
具体操作自行学习
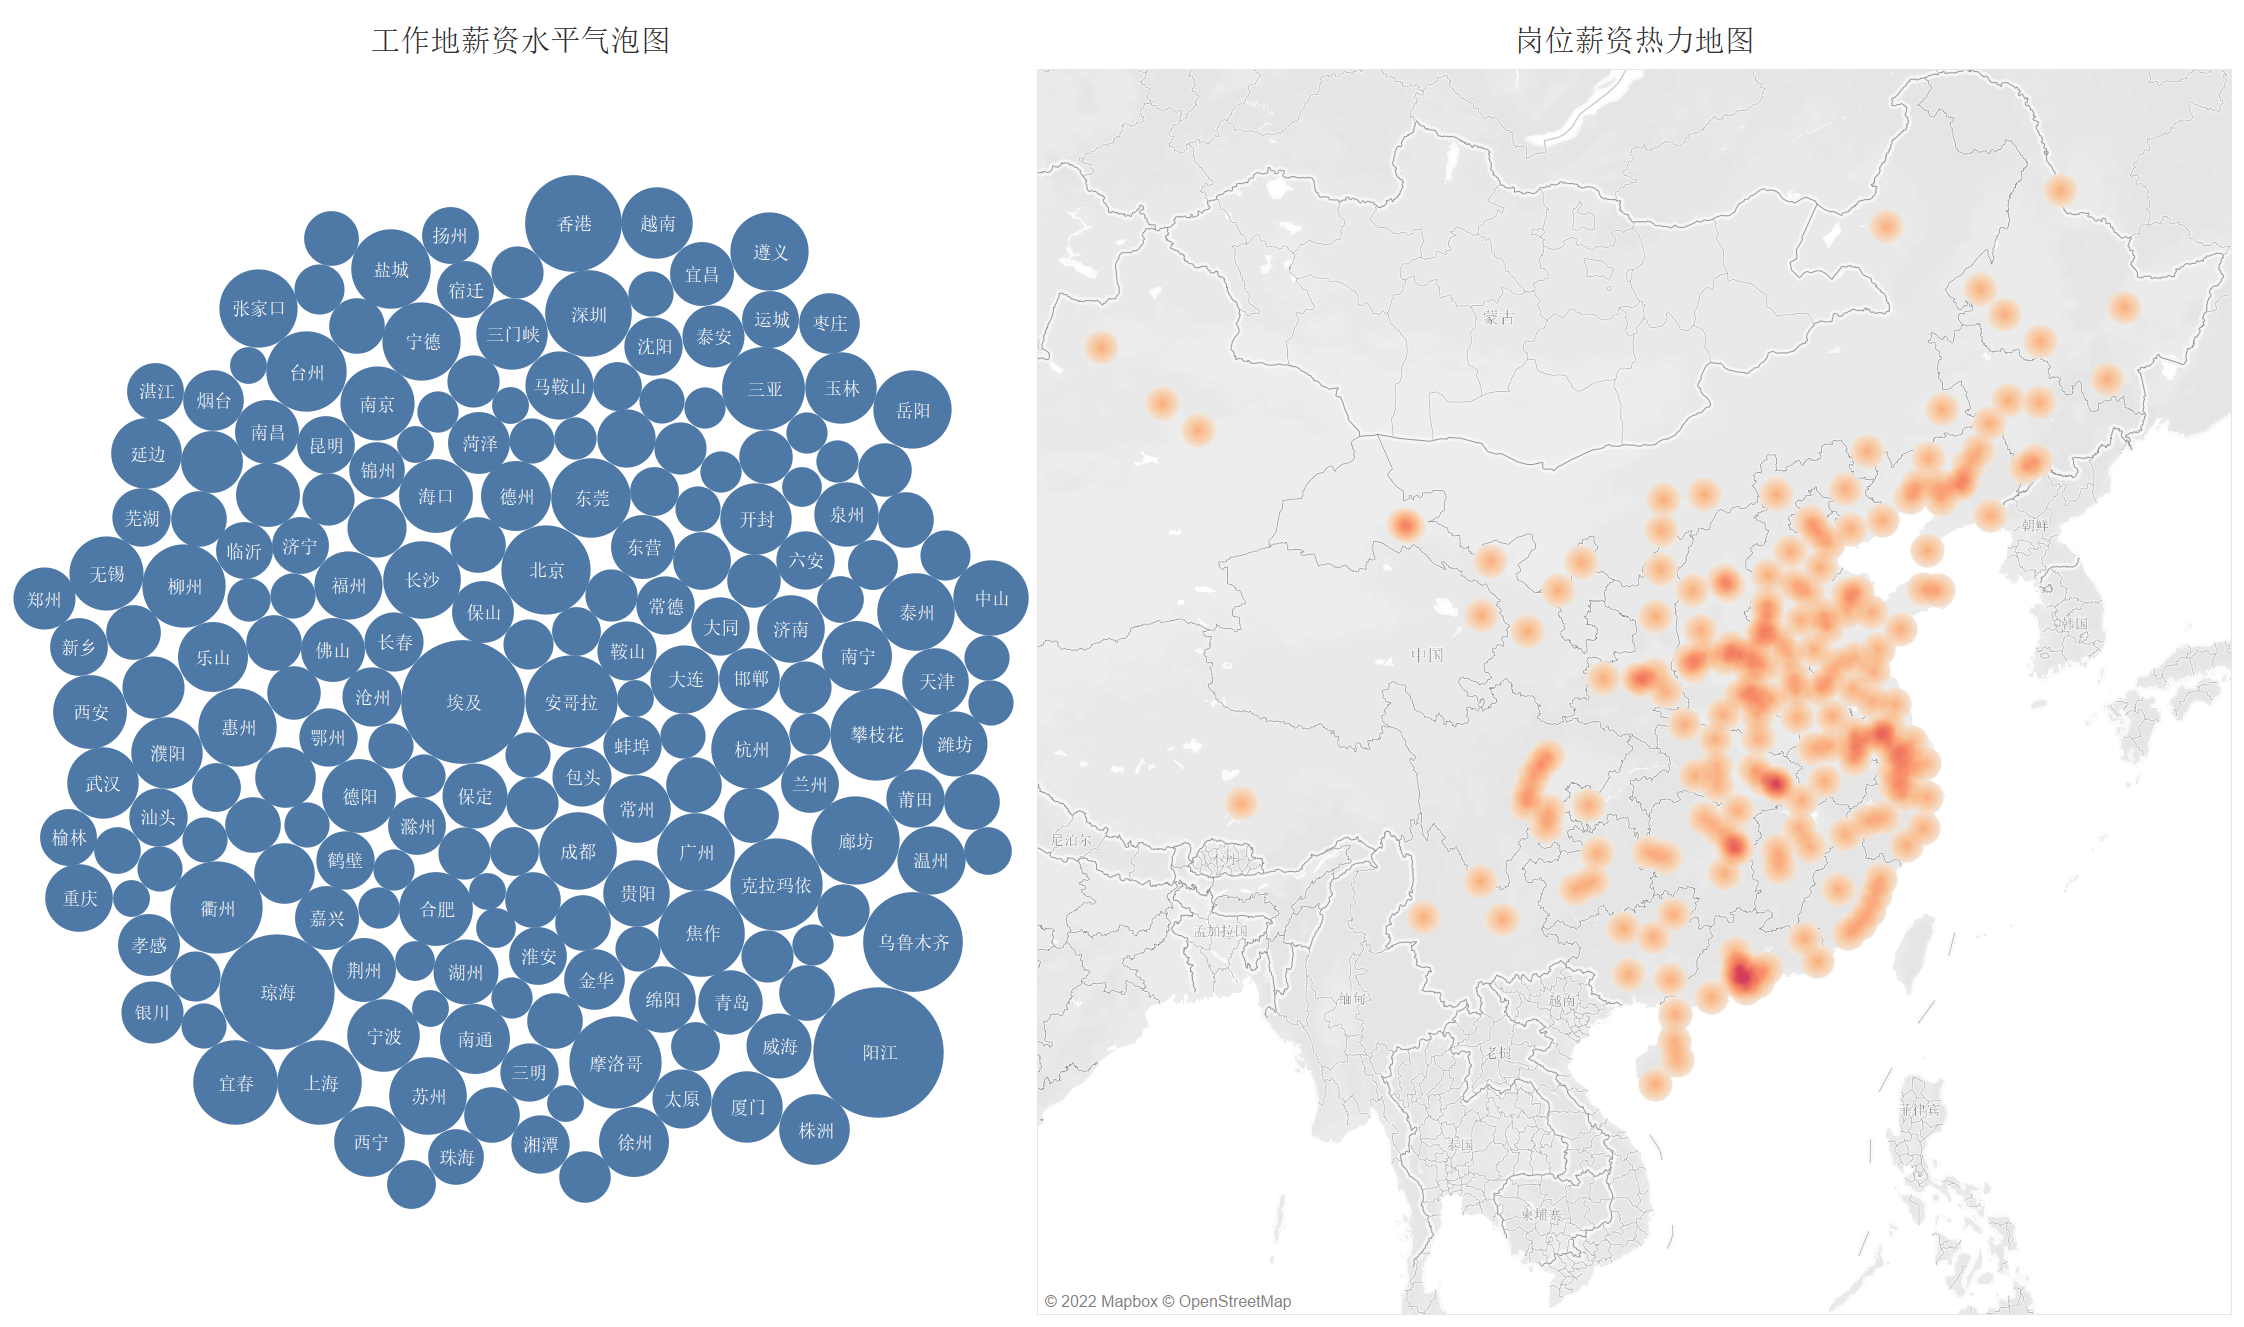
3.2 DataFocus可视化大屏
推荐教材:大数据可视化与DataFocus实践 浙江工商大学 董雪梅
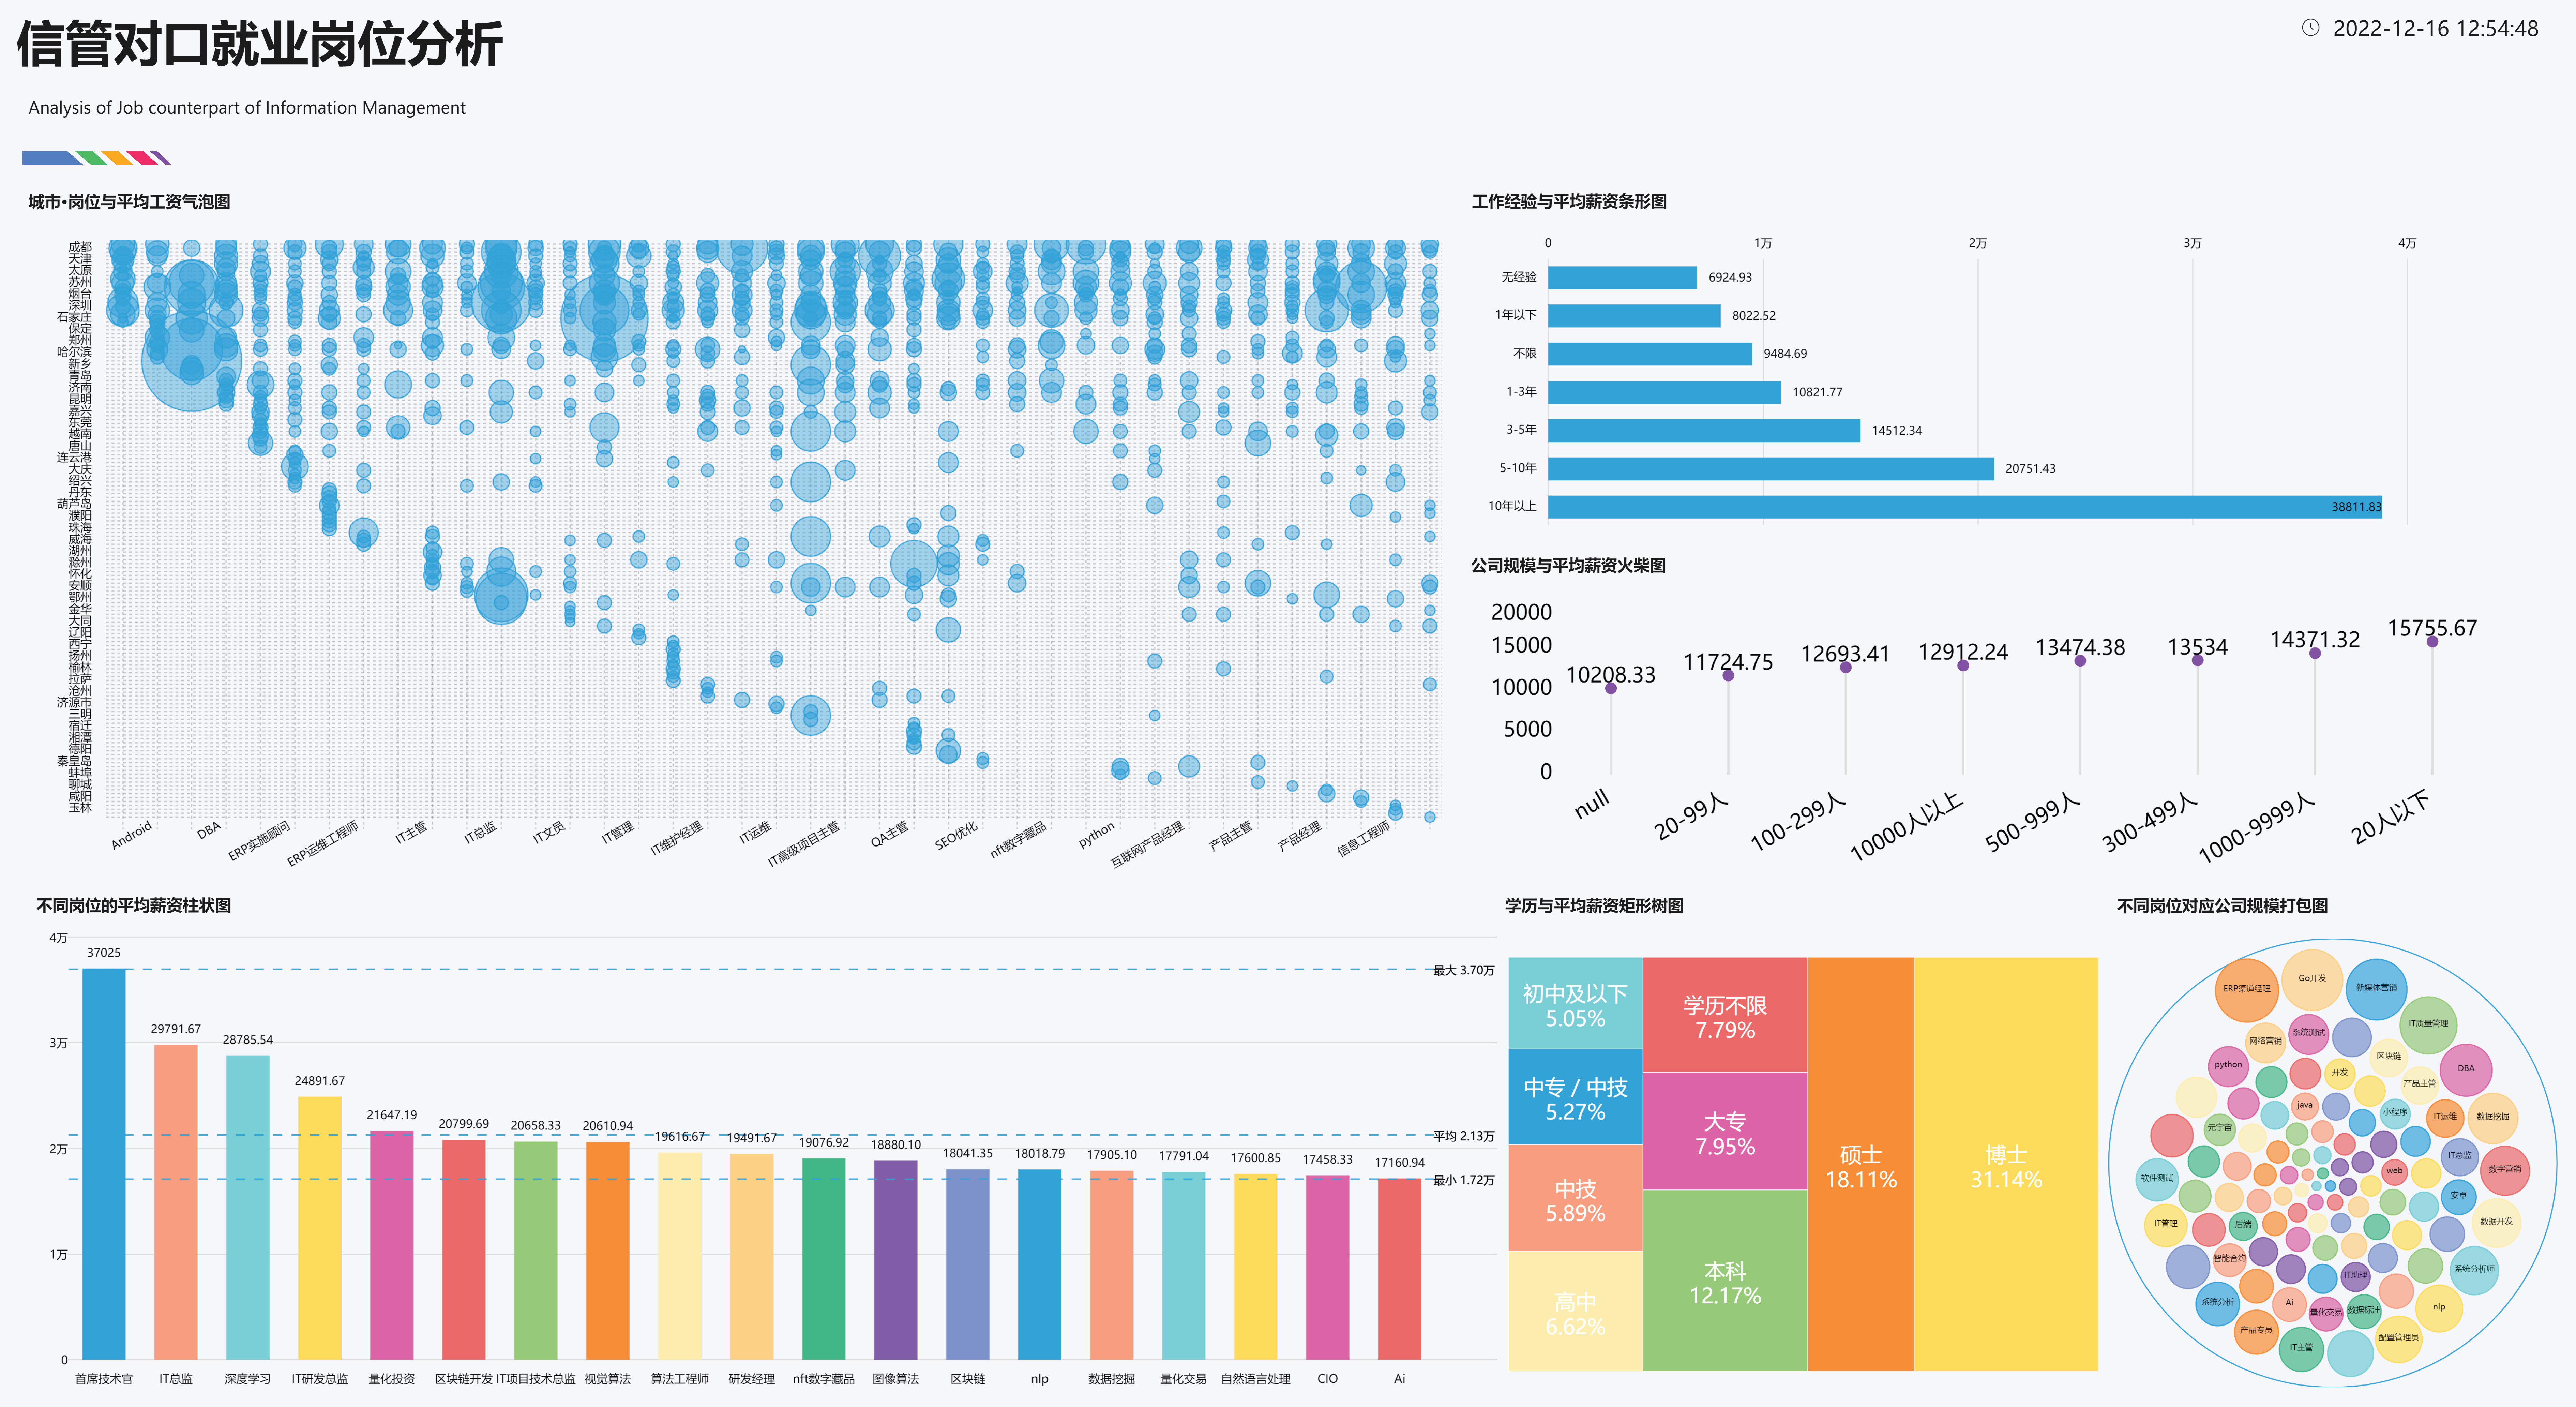
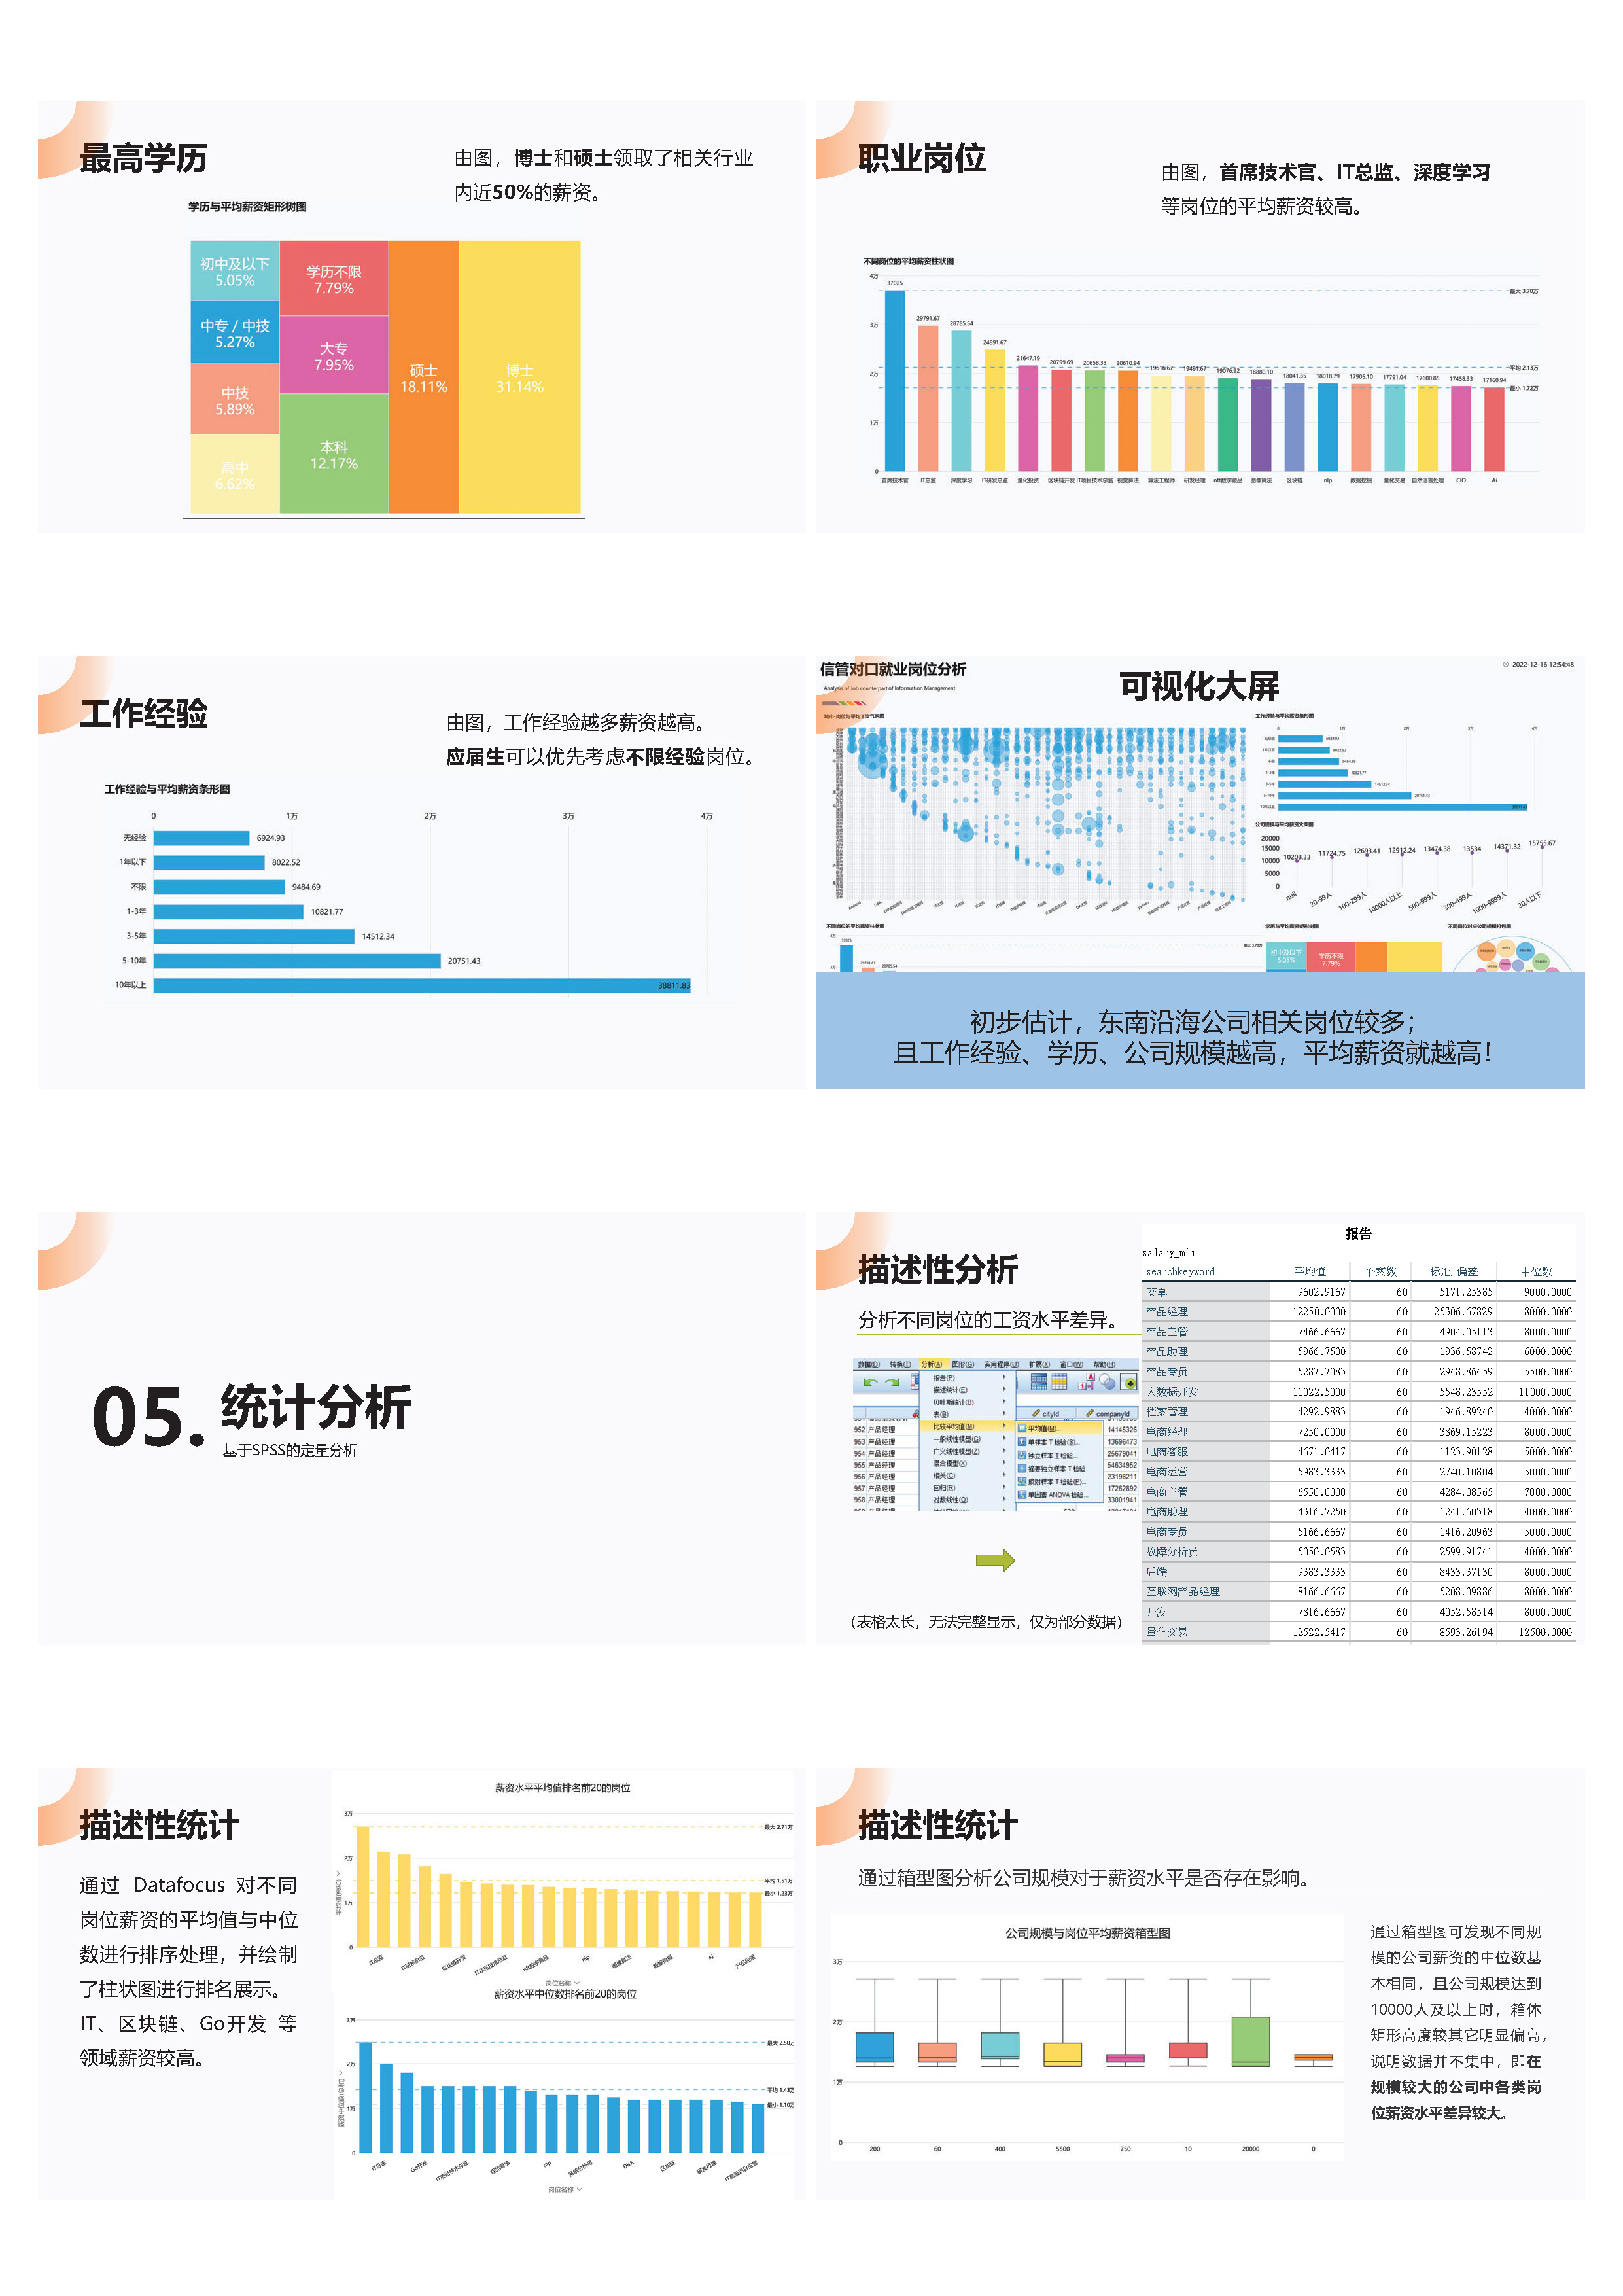
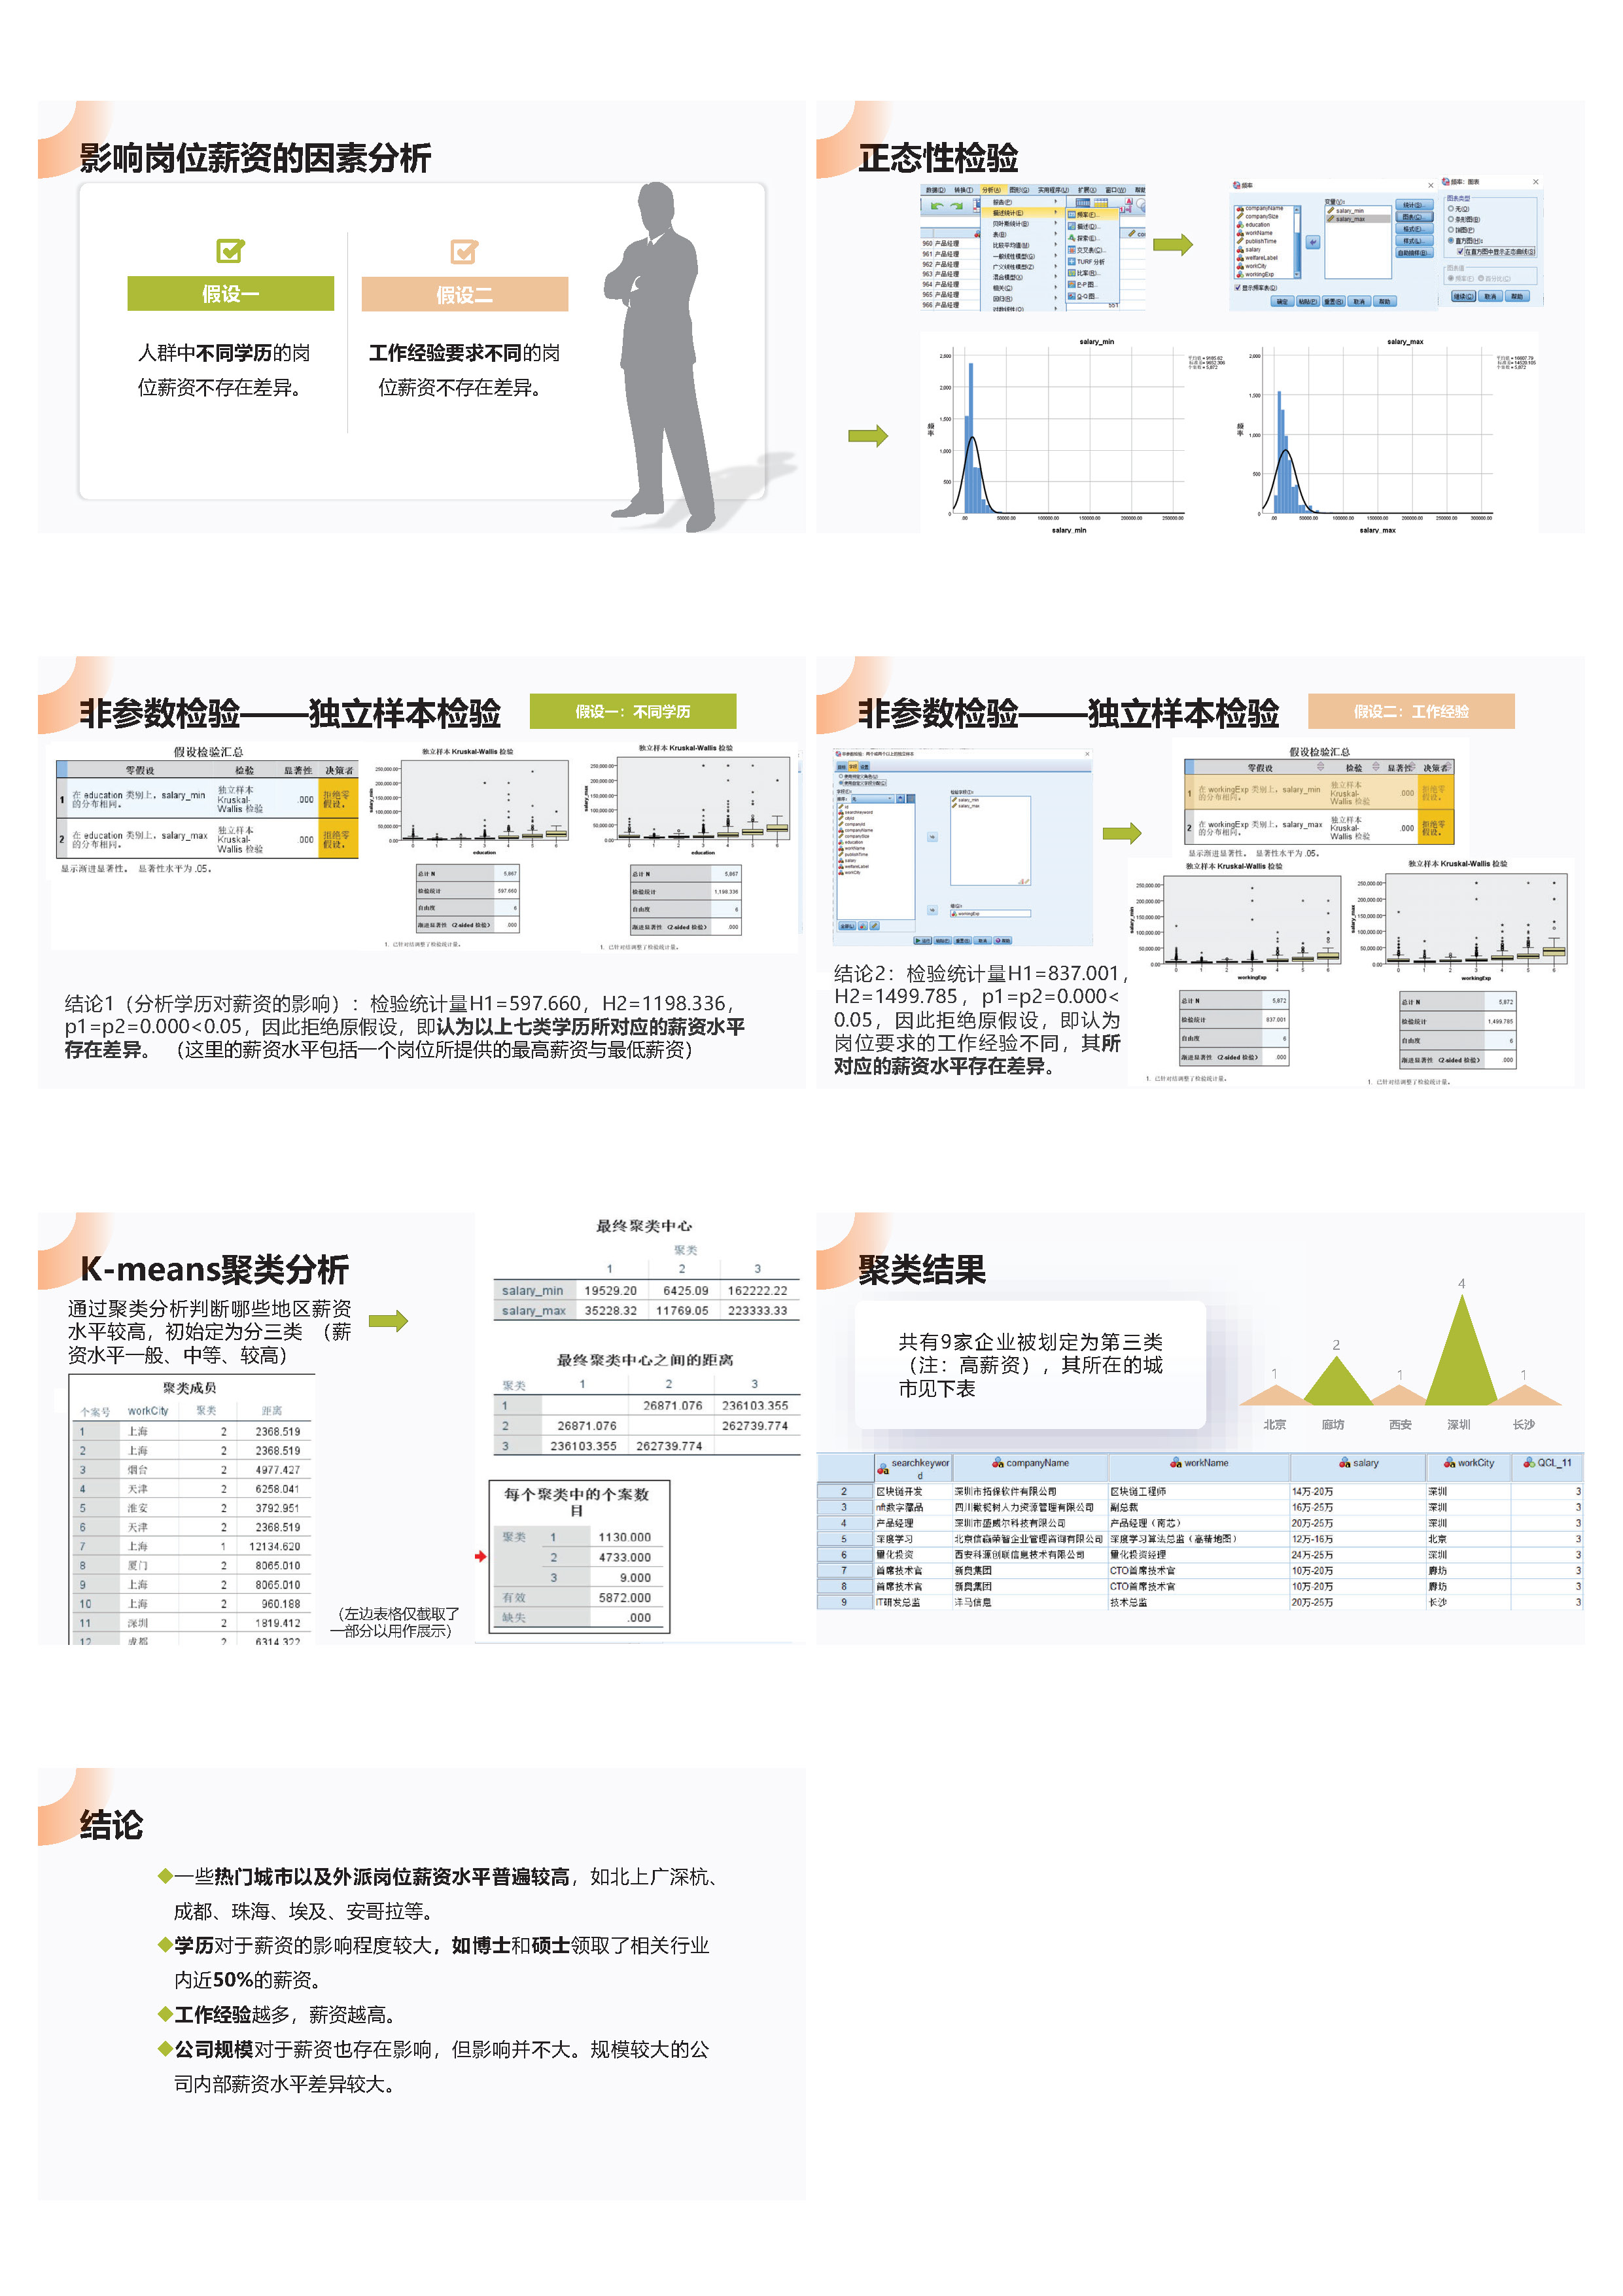
4.PPT展示汇总


 浙公网安备 33010602011771号