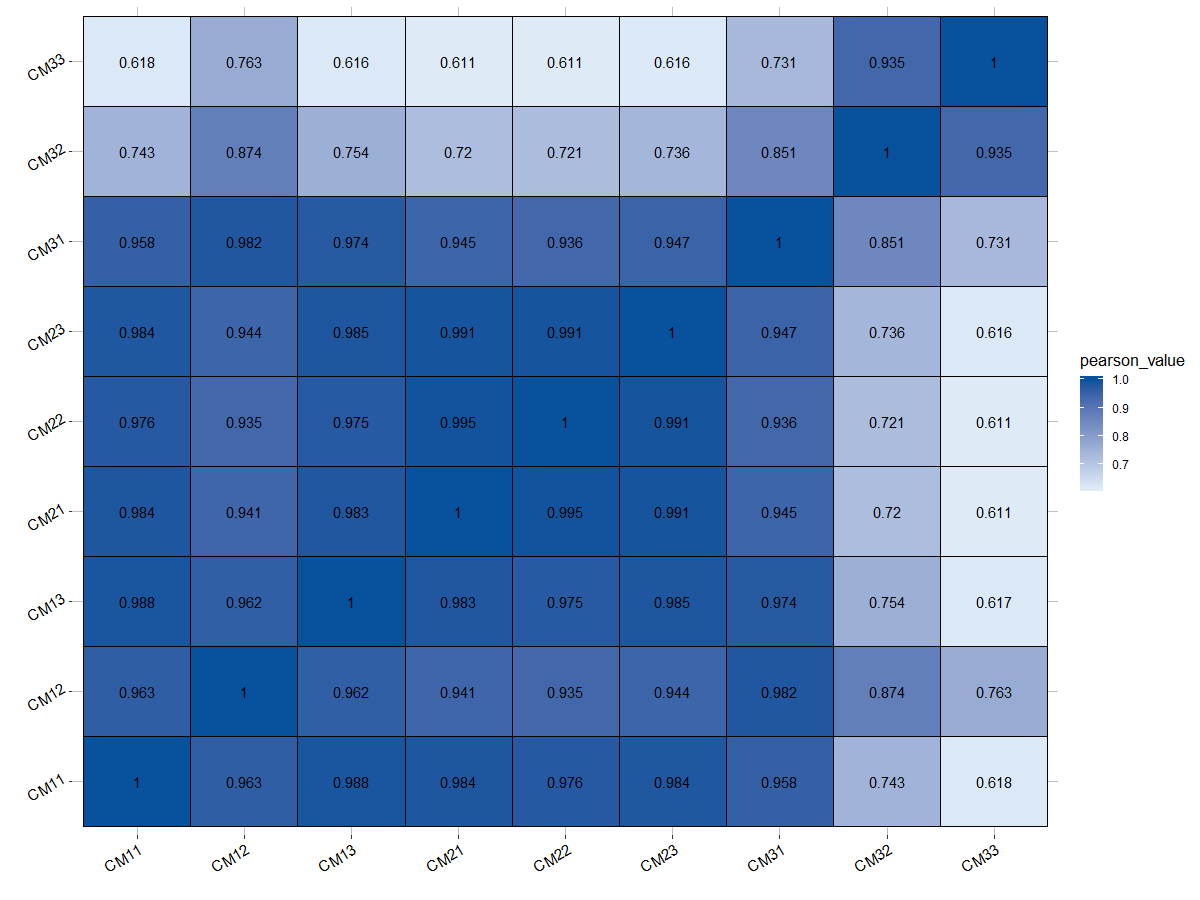
画相关性热图
- 数据格式如下
Sample CM11 CM12 CM13 CM21 CM22 CM23 CM31 CM32 CM33
CM11 1 0.9627369 0.9884578 0.9841946 0.9762492 0.983613 0.9575127 0.743262 0.6178
CM12 0.9627369 1 0.9616447 0.9405868 0.9354329 0.9442101 0.9816946 0.8740325 0.7634
CM13 0.9884578 0.9616447 1 0.9827691 0.9754358 0.9845702 0.9736013 0.7541648 0.6165
CM21 0.9841946 0.9405868 0.9827691 1 0.9949495 0.9914846 0.9445855 0.7201134 0.6109
CM22 0.9762492 0.9354329 0.9754358 0.9949495 1 0.9911021 0.936078 0.7206804 0.6109
CM23 0.983613 0.9442101 0.9845702 0.9914846 0.9911021 1 0.9469456 0.7364044 0.6163
CM31 0.9575127 0.9816946 0.9736013 0.9445855 0.936078 0.9469456 1 0.8512908 0.7314
CM32 0.743262 0.8740325 0.7541648 0.7201134 0.7206804 0.7364044 0.8512908 1 0.9350
CM33 0.6178754 0.76344 0.6165455 0.6109218 0.6109854 0.6163989 0.731487 0.935035 1
作图代码如下:
library(reshape2)
library(ggplot2)
library(RColorBrewer)
x <- read.table("AllSamples.correlation.xls", sep = "\t", head = T)
xx = as.matrix(x[,-1])
rownames(xx) = names(x)[-1]
xx = melt(xx)
names(xx)=c("Var1","Var2","pearson_value");
pdf("AllSamples.CorrelationHeatmap.pdf",width=9,height=9)
ggplot(xx, aes(Var1, Var2, fill=pearson_value))+
 #geom_tile(width=0.8, height=0.8)+
  geom_tile(color='black')+
  geom_text(label=round(xx$pearson_value, 3))+
  scale_fill_gradient(low='#DEEBF7',high='#08519C')+
  theme(axis.text = element_text(angle=30, hjust=1,size=11,vjust=0,color='black'),
  panel.background = element_rect(fill='transparent'),
  panel.grid=element_line(color='grey'),legend.title = element_text(size = 13))+
  labs(x="",y="")
dev.off()- 图片效果如下


