

Qt Charts 下的BarChart数据系列标签显示Bug
工作已有一段时间,终于有时间把接触到的各种问题及解决方案记录在博客上了。
废话不多说,开始正文。
由于项目(Qt-5.8.0 + MSVC-2013_x64, Win7 平台)涉及一个图表模块,这个模块需要根据数据生成简单的柱状图。要求代表数据系列的柱子外侧上方显示数据系列的标签,表示当前柱子的数值。
自然而然地,小组成员想到了利用Qt Charts模块完成需求。然而同事发现,以下代码无法将数据系列标签正确地显示于柱子之外的上方。实际上,在同事的机器上,柱状图左侧的数据柱没有显示任何数据系列标签,柱状图右侧的数据柱可以正确显示数据系列标签。
    QBarSeries *series = new QBarSeries();
    //...
    series->setLabelsPosition(QAbstractBarSeries::LabelsOutsideEnd); // 设置数据系列标签的位置于数据柱外侧上方
    series->setLabelsVisible(true); //显示数据系列标签
百思不得其解,我在我机器上调试同事的代码,发现我这边居然一个数据系列标签都不显示了。
打开Qt的Examples的BarChart Example并编译运行之。确认是Qt的Bug,和同事的代码无关。同时我在自己的笔记本上Qt-5.10.1运行Qt的这个例子,发现问题依旧。
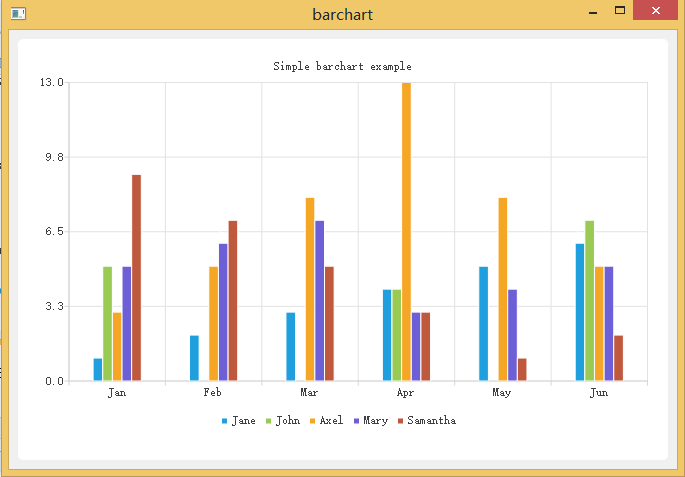
效果如下图(数据柱中间的小白线就是不正常显示的数据系列标签):
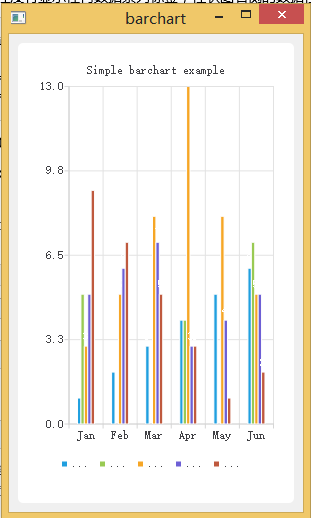
如果拉伸柱状图,直接就看不到数据系列标签了:
但是,只要设置数据系列标签的位置在其它位置(柱子内测上方),就可以正常显示数据系列标签了:
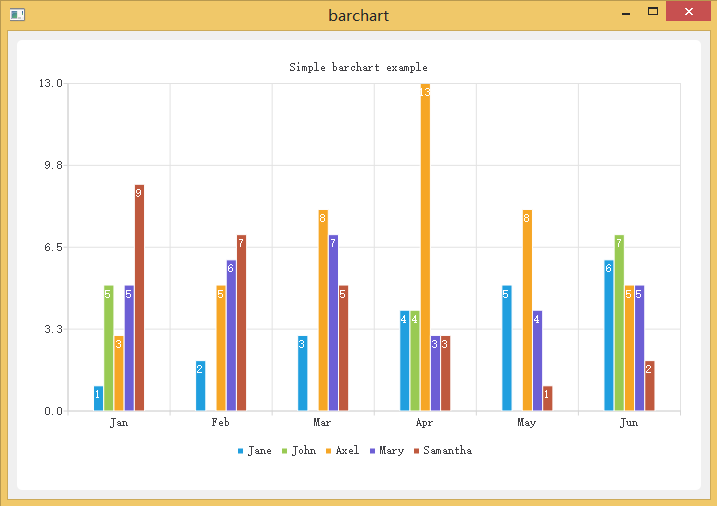
代码如下:
/****************************************************************************
**
** Copyright (C) 2016 The Qt Company Ltd.
** Contact: https://www.qt.io/licensing/
**
** This file is part of the Qt Charts module of the Qt Toolkit.
**
** $QT_BEGIN_LICENSE:GPL$
** Commercial License Usage
** Licensees holding valid commercial Qt licenses may use this file in
** accordance with the commercial license agreement provided with the
** Software or, alternatively, in accordance with the terms contained in
** a written agreement between you and The Qt Company. For licensing terms
** and conditions see https://www.qt.io/terms-conditions. For further
** information use the contact form at https://www.qt.io/contact-us.
**
** GNU General Public License Usage
** Alternatively, this file may be used under the terms of the GNU
** General Public License version 3 or (at your option) any later version
** approved by the KDE Free Qt Foundation. The licenses are as published by
** the Free Software Foundation and appearing in the file LICENSE.GPL3
** included in the packaging of this file. Please review the following
** information to ensure the GNU General Public License requirements will
** be met: https://www.gnu.org/licenses/gpl-3.0.html.
**
** $QT_END_LICENSE$
**
****************************************************************************/

#include <QtWidgets/QApplication>
#include <QtWidgets/QMainWindow>
#include <QtCharts/QChartView>
#include <QtCharts/QBarSeries>
#include <QtCharts/QBarSet>
#include <QtCharts/QLegend>
#include <QtCharts/QBarCategoryAxis>

QT_CHARTS_USE_NAMESPACE

int main(int argc, char *argv[])
{
    QApplication a(argc, argv);

//![1]
    QBarSet *set0 = new QBarSet("Jane");
    QBarSet *set1 = new QBarSet("John");
    QBarSet *set2 = new QBarSet("Axel");
    QBarSet *set3 = new QBarSet("Mary");
    QBarSet *set4 = new QBarSet("Samantha");

    *set0 << 1 << 2 << 3 << 4 << 5 << 6;
    *set1 << 5 << 0 << 0 << 4 << 0 << 7;
    *set2 << 3 << 5 << 8 << 13 << 8 << 5;
    *set3 << 5 << 6 << 7 << 3 << 4 << 5;
    *set4 << 9 << 7 << 5 << 3 << 1 << 2;
//![1]

//![2]
    QBarSeries *series = new QBarSeries();
    series->append(set0);
    series->append(set1);
    series->append(set2);
    series->append(set3);
    series->append(set4);
    series->setLabelsPosition(QAbstractBarSeries::LabelsInsideEnd); // 设置数据系列标签的位置于数据柱内测上方
    series->setLabelsVisible(true); // 设置显示数据系列标签

//![2]

//![3]
    QChart *chart = new QChart();
    chart->addSeries(series);
    chart->setTitle("Simple barchart example");
    chart->setAnimationOptions(QChart::SeriesAnimations);
//![3]

//![4]
    QStringList categories;
    categories << "Jan" << "Feb" << "Mar" << "Apr" << "May" << "Jun";
    QBarCategoryAxis *axis = new QBarCategoryAxis();
    axis->append(categories);
    chart->createDefaultAxes();
    chart->setAxisX(axis, series);
//![4]

//![5]
    chart->legend()->setVisible(true);
    chart->legend()->setAlignment(Qt::AlignBottom);
//![5]

//![6]
    QChartView *chartView = new QChartView(chart);
    chartView->setRenderHint(QPainter::Antialiasing);
//![6]

//![7]
    QMainWindow window;
    window.setCentralWidget(chartView);
    window.resize(420, 300);
    window.show();
//![7]

    return a.exec();
}
结论:目前在Qt-5.10.1及以下的Qt版本中,无法让数据系列标签显示在柱状图外侧上方。
如有错误之处还请指正,谢谢!
