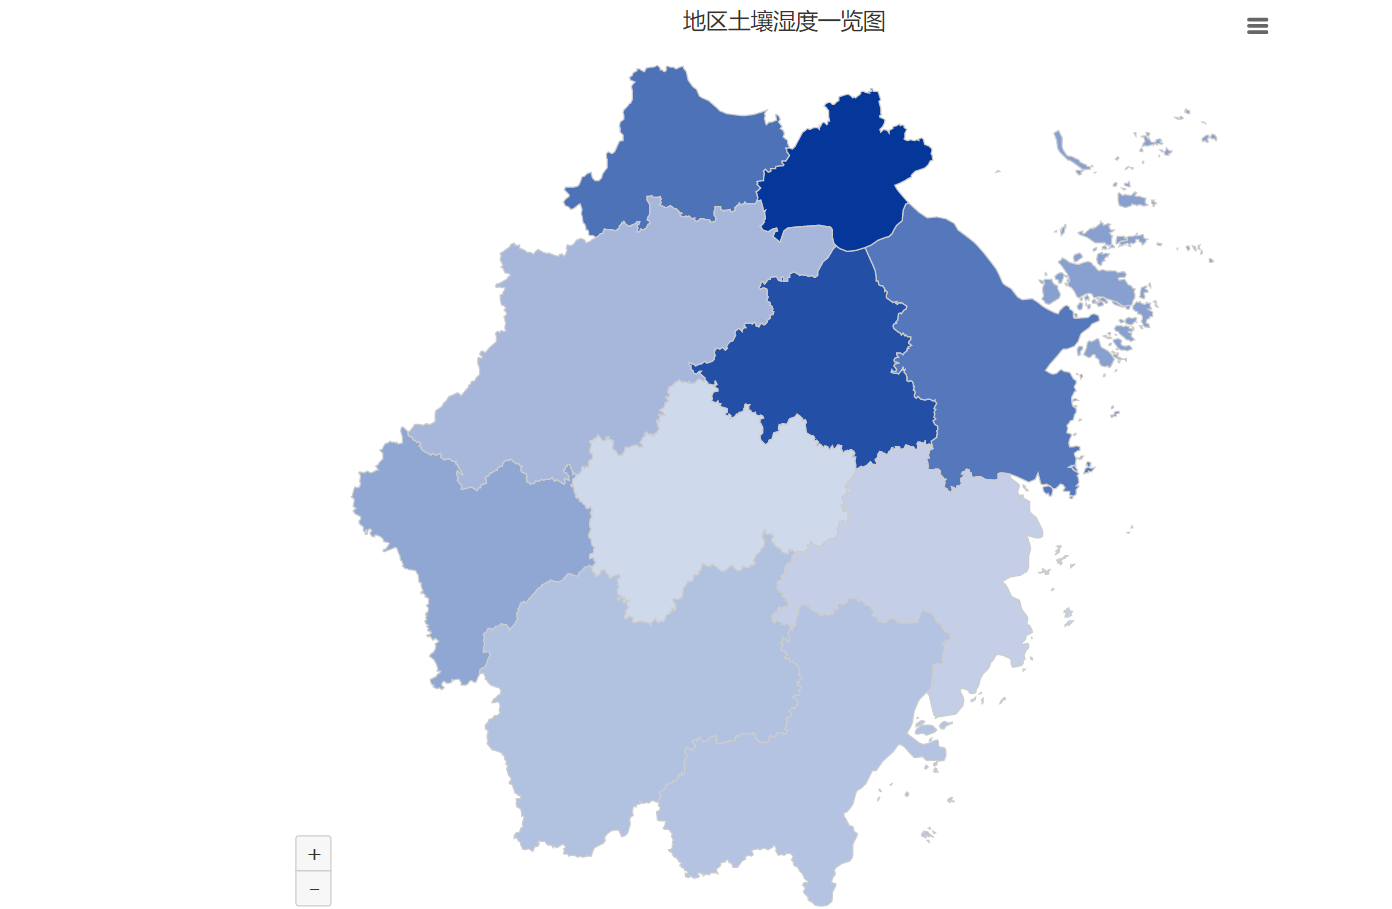
HighMap插件点击获取地区的name
在练习使用HighMap这个插件时,遇到了这样的需求,加载一幅地图结束后,点击地图某一区域,从而加载详细的信息(不是地图的下钻)

如图标题所示,想要在点击图中区域后加载详细的该地区数据,以其它图表的形式展示
左图html
<!doctype html>
<html>
<head>
    <meta charset="utf-8">
    <title>地图插件</title>
    <style type="text/css">
        #container {
    height: 800px;
    min-width: 310px;
    max-width: 800px;
    margin: 0 auto;
}
.loading {
    margin-top: 10em;
    text-align: center;
    color: gray;
}
    </style>
</head>
<body>
   <div id="container"></div>
</body>
        <script src="https://code.highcharts.com.cn/jquery/jquery-1.8.3.min.js"></script>
        <script src="https://code.highcharts.com.cn/highmaps/highmaps.js"></script>
        <script src="https://code.highcharts.com.cn/highcharts/modules/exporting.js"></script>
        <script src="https://code.highcharts.com.cn/highcharts/modules/data.js"></script>
        <script src="https://code.highcharts.com.cn/highcharts/modules/drilldown.js"></script>
        <script type="text/javascript">
            // Instanciate the map
var data = [
    ['杭州', 28],
    ['金华', 10],
    ['宁波', 63],
    ['舟山', 41],
    ['温州', 22],
    ['湖州', 66],
    ['嘉兴', 98],
    ['绍兴', 85],
    ['丽水', 23],
    ['台州', 15],
    ['衢州', 37]
];
$.getJSON('https://data.jianshukeji.com/jsonp?filename=geochina/zhejiang.json&callback=?', function (geojson) {
    // Initiate the chart==

    Highcharts.mapChart('container', {
        title: {
            text: '地区土壤湿度一览图'
        },
        mapNavigation: {
            enabled: true,
            buttonOptions: {
                verticalAlign: 'bottom'
            }
        },
        colorAxis: {
            tickPixelInterval: 100
        },
        series: [{
            data: data,
            mapData: geojson,
            joinBy: 'name',
            keys: ['name', 'value'],
            name: 'Random data',
            states: {
                hover: {
                    color: '#a4edba'
                }
            },

            dataLabels: {
                enabled: true,
                format: '{point.properties.postal}'
            },

            events:{


               }

        }]
    });
});

        </script>
</html>
通过查阅文档和相关的官方示例可通过在主配置文件中添加如下代码,这样就能获得点击区域的key和value了
    plotOptions: {
            series: {
                events: {
                    click: function (e) {
                               alert(e.point.name);//获得name  ,e.point.value获得value
                    }
                }
            }
        },


