感知机学习算法
1.感知机
感知机是二类分类线性分类模型,输出的值为{+1, -1}两种类型;感知机是利用超平面将两类分离的算法。
假设输入空间(特征空间)是X∈Rn,输出空间是Y={+1, -1}。输入x∈X表示实例特征向量。对应于输出空间(特征空间)的点:输出y∈Y表示实例类别,由输入空间到输出空间的如下函数:
f(x) = sign(w*x+b)
线性方程:
w*x+b=0
对应于特征空间Rn 中的一个超平面S,其中w是超平面的法向量,b是超平面的截距。
2.感知机学习策略
单个点x0到超平面S的距离是:
对于误分类来说,-yi(w*xi+b)>0。因此误分类点到超平面S的距离
假设超平面S误分类点集合为M,则总距离:
因此,感知机sign(wx+b)的损失函数可以简写为:
3.感知机原始形式
假设M集合是固定,那么损失函数的梯度为:
随机一个选取一个误分类点(xi, yi)对w和b进行更新。

 1  # coding:utf-8
 2 import matplotlib.pyplot as plt
 3 import numpy as np
 4
 5 def dataN(length):#生成数据
 6     x=[[1,x/100.0,x/100.0+ (x%2)*1.5 + np.random.uniform(0,1.2)] for x in range(length)]
 7     y=[(-1)**(y%2-1) for y in range(length)]
 8     x=np.mat(x)
 9     return x,y
10
11 def percepT(x,y, iter):#感知机原始形式
12     n =np.shape(x)[1]
13     m=len(x)
14     theta=np.ones(n)
15     alpha=0.02
16     for it in range(iter):
17        l=0
18        print it  #0 1 2 3 4 5 6 7
19        for k in range(m):
20            if (x[k].dot(theta.T))*y[k]<0:
21                l=1
22                theta=np.add(theta,alpha*y[k]*x[k])
23        if l==0:
24             break
25     return theta
26
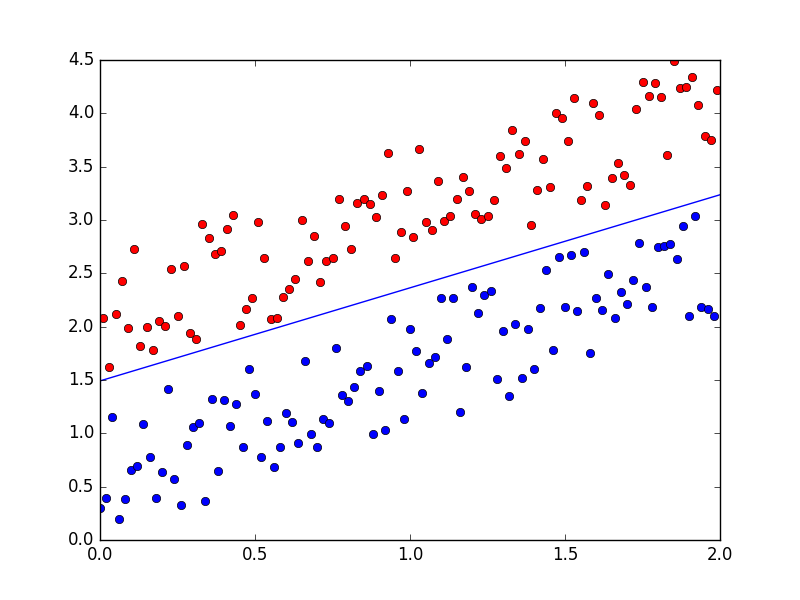
27 def showP(x,y,theta):#作图
28     plt.figure(1)
29     color=['','or','ob']
30     for i in xrange(length):
31         plt.plot(x[i, 1], x[i, 2],color[int(y[i])])
32     theta=theta.getA()
33     plt.plot([0,length/100],[-theta[0][0],-theta[0][0]-theta[0][1]*length/100]/theta[0][2])
34     plt.show()
35
36 length=200
37 iter=200
38 x,y=dataN(length)
39 theta=percepT(x,y,iter)
40 print theta   #[[-0.38       -0.2464      0.25287193]]
41 showP(x,y,theta)
4.感知机对偶形式
对偶形似的基本想法是:将w和b表示实例xi和标记yi的线性组合形式,通过求解器系数的到w和b。在原始形式中,通过
逐步修改w和b,假设修改了n次,则w和b关于(xi, yi)的增量分别是aixiyi和aiyi,这里的ai=niη。最后学习到的w和b是:
 1  # coding:utf-8
 2 import matplotlib.pyplot as plt
 3 import numpy as np
 4
 5 def dataN(length):#生成数据
 6     x=[[x/100.0,x/100.0+ (x%2)*1.5 + np.random.uniform(0,1.2)] for x in range(length)]
 7     y=[(-1)**(y%2-1) for y in range(length)]
 8     x=np.mat(x)
 9     return x,y
10
11 def percepTG(x,y, iter):#感知机对偶形式
12     m=len(x)
13     theta=np.zeros(m)
14     b=0
15     alpha=0.1
16     for it in range(iter):
17        l=0
18        print it  #0 1 2
19        for k in range(m):
20            if y[k]*(np.sum([theta[j]*y[j]*x[j]*x[k].T for j in range(m)])+b)<=0:
21                l=1
22                theta[k]+=alpha
23                b+=alpha*y[k]
24        if l==0:
25             break
26     return theta,b
27
28 def showP(x,y,theta,b):#作图
29     plt.figure(1)
30     color=['','or','ob']
31     for i in xrange(len(x)):
32         plt.plot(x[i, 0], x[i, 1],color[int(y[i])])
33     c= np.zeros(2)
34     for j in range(len(x)):
35         c=np.add(c,theta[j]*y[j]*x[j])
36     c=c.getA()
37     print c,b  #[[-0.351     0.402276]] -0.6
38     plt.plot([0,length/100],[-b,-b-c[0][0]*length/100]/c[0][1])
39     plt.show()
40
41 length=200
42 iter=5
43 x,y=dataN(length)
44 theta,b=percepTG(x,y,iter)
45 showP(x,y,theta,b)


