Telegraf+Influxdb+Grafana
一、InfluxDB的安装与部署
1、下载安装
wget https://dl.influxdata.com/influxdb/releases/influxdb-1.8.1.x86_64.rpm
yum localinstall influxdb-1.8.1.x86_64.rpm
2、修改数据存放路径
创建数据目录
mkdir -p /data/influxdb/{meta,data,wal}
修改属主
chown  -R influxdb.influxdb /data/influxdb/
3、启动服务
systemctl start influxdb
systemctl status influxdb
systemctl enable influxdb
4、创建数据库并授权
influx
Connected to http://localhost:8086 version 1.8.1
InfluxDB shell version: 1.8.1
> create database telegraf;
> create user "xxx" with password 'xxx' with all privileges;
5、开启登陆认证
修改 /etc/influxdb/influxdb.conf 文件中的[http]部分,将以下两个参数设置为true
[http]
  # Determines whether HTTP endpoint is enabled.
enabled = true

  # Determines whether user authentication is enabled over HTTP/HTTPS.
auth-enabled = true
重启
systemctl restart influxdb
使用用户名密码登陆
influx -username xxx -password 'xxxx'
6、修改数据保留策略
数据保留策略是用来定义数据的存放时长,或者是保留某一时间段的数据。每个数据库可以有多个数据保留策略,但只能有一个默认策略
查看策略
show retention policies on telegraf

> show retention policies on telegraf
name    duration shardGroupDuration replicaN default

对于 数据库 telegraf 创建一个策略 '1_month' duration(持续时间)为30天,副本为1,设置为默认策略。

create retention policy "1_month" on "telegraf" duration 30d replication 1 default

show retention policies on telegraf
name    duration shardGroupDuration replicaN default
----    -------- ------------------ -------- -------
autogen 0s       168h0m0s           1        false
1_month 720h0m0s 24h0m0s            1        true
二、Grafana安装部署
1、安装
wget https://dl.grafana.com/oss/release/grafana-6.7.1-1.x86_64.rpm

rpm -i --nodeps grafana-6.7.1-1.x86_64.rpm

#如有报错请安装相关依赖
yum install fontconfig urw-fonts
2、修改数据存放路径
vim  /etc/grafana/grafana.ini

修改如下路径
data = /data/grafana/lib/grafana
logs = /data/grafana/log/grafana
plugins = /data/grafana/lib/grafana/plugins

需要注意的是:.ini文件中分号“;”是注释该行标准方法。如果要更改设置,必须先删除设置前面的分号(;),然后才能起作用。

创建目录
mkdir -p /data/grafana/lib/grafana
mkdir -p /data/grafana/log/grafana
mkdir -p /data/grafana/lib/grafana/plugins

修改属主
cd /data
chown -R grafana:grafana grafana/

启动
systemctl start grafana-server
三、Telegraf安装部署
wget https://dl.influxdata.com/telegraf/releases/telegraf-1.15.1-1.x86_64.rpm
yum localinstall telegraf-1.15.1-1.x86_64.rpm
创建日志文件目录
mkdir /data/telegraf/
cd /data/telegraf/
chown -R telegraf:telegraf telegraf/
生成配置文件

mv /etc/telegraf/telegraf.conf /etc/telegraf/telegraf.conf-bak

vim /etc/telegraf/telegraf.conf
[global_tags]
[agent]
interval = "10s"
round_interval = true
metric_batch_size = 1000
metric_buffer_limit = 10000
collection_jitter = "0s"
flush_interval = "10s"
flush_jitter = "0s"
precision = ""
debug = false
quiet = false
logfile = "/data/telegraf/telegraf.log"
hostname = "127.0.0.1"
omit_hostname = false
[[outputs.influxdb]]
urls = ["http://127.0.0.1:8086"]
database = "telegraf"
retention_policy = ""
username = "xxx"
password = "xxxx"
[[inputs.cpu]]
percpu = false
totalcpu = true
collect_cpu_time = false
report_active = false
fieldpass = ["usage_idle", "usage_iowait", "usage_system", "usage_user"]
[[inputs.mem]]
interval = "10m"
fieldpass = ["total","available","used","available_percent","used_percent"]
[[inputs.net]]
interfaces = ["eth*"]
fieldpass = ["bytes_recv", "bytes_sent"]
[[inputs.system]]
interval = "1m"
[[inputs.disk]]
interval = "10m"
fieldpass = ["free", "used_percent"]
ignore_fs = ["tmpfs", "devtmpfs", "devfs", "overlay", "aufs", "squashfs"]
[[inputs.ping]]
urls = ["www.baidu.com"]
count = 3
fieldpass = ["average_response_ms", "percent_packet_loss"]
ping_interval = 1.0
timeout = 2.0
You have new mail in /var/spool/mail/root
启动,查看日志
systemctl start telegraf.service

cat /data/telegraf/telegraf.log
2021-05-19T03:20:53Z I! Loaded inputs: cpu
2021-05-19T03:20:53Z I! Loaded aggregators:
2021-05-19T03:20:53Z I! Loaded processors:
2021-05-19T03:20:53Z I! Loaded outputs: influxdb
2021-05-19T03:20:53Z I! Tags enabled: host=127.0.0.1
2021-05-19T03:20:53Z I! [agent] Config: Interval:10s, Quiet:false, Hostname:"127.0.0.1", Flush Interval:10s
2021-05-19T03:24:32Z I! [agent] Hang on, flushing any cached metrics before shutdown
2021-05-19T03:24:32Z I! Loaded inputs: cpu
2021-05-19T03:24:32Z I! Loaded aggregators:
2021-05-19T03:24:32Z I! Loaded processors:
2021-05-19T03:24:32Z I! Loaded outputs: influxdb
2021-05-19T03:24:32Z I! Tags enabled: host=1127.0.0.1
2021-05-19T03:24:32Z I! [agent] Config: Interval:10s, Quiet:false, Hostname:"127.0.0.1", Flush Interval:10s
2021-05-19T03:25:51Z I! [agent] Hang on, flushing any cached metrics before shutdown
2021-05-19T03:25:52Z I! Loaded inputs: cpu
2021-05-19T03:25:52Z I! Loaded aggregators:
2021-05-19T03:25:52Z I! Loaded processors:
2021-05-19T03:25:52Z I! Loaded outputs: influxdb
2021-05-19T03:25:52Z I! Tags enabled: host=10.4.0.24
2021-05-19T03:25:52Z I! [agent] Config: Interval:10s, Quiet:false, Hostname:"127.0.0.1", Flush Interval:10s
进入InfluxDB查看数据已经正常采集
> use telegraf
Using database telegraf
> select * from cpu;
name: cpu
time cpu host usage_idle usage_iowait usage_system usage_user
---- --- ---- ---------- ------------ ------------ ----------
1621395040000000000 cpu-total 127.0.0.1 99.62462462370077 0.025025025025011357 0.17517517517166548 0.10010010009776941
1621395050000000000 cpu-total 127.0.0.1 99.8246932123753 0.0250438266968834 0.0500876533937668 0.0500876533937668
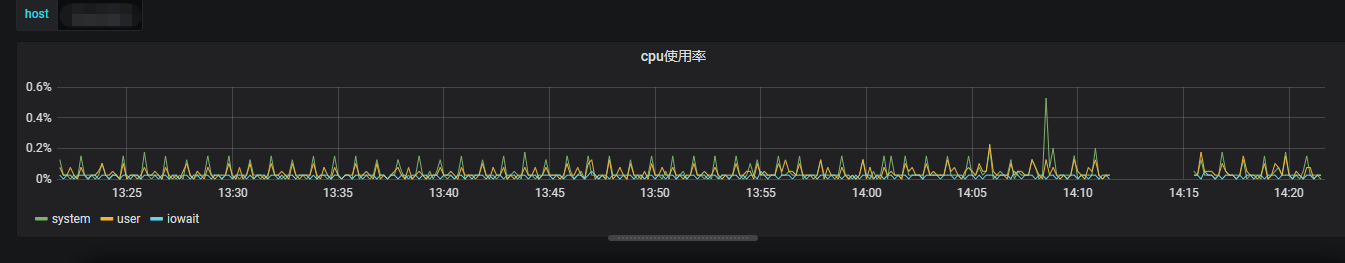
四、grafana页面配置
登录
登录
http://ip:3000

默认账密:admin/admin
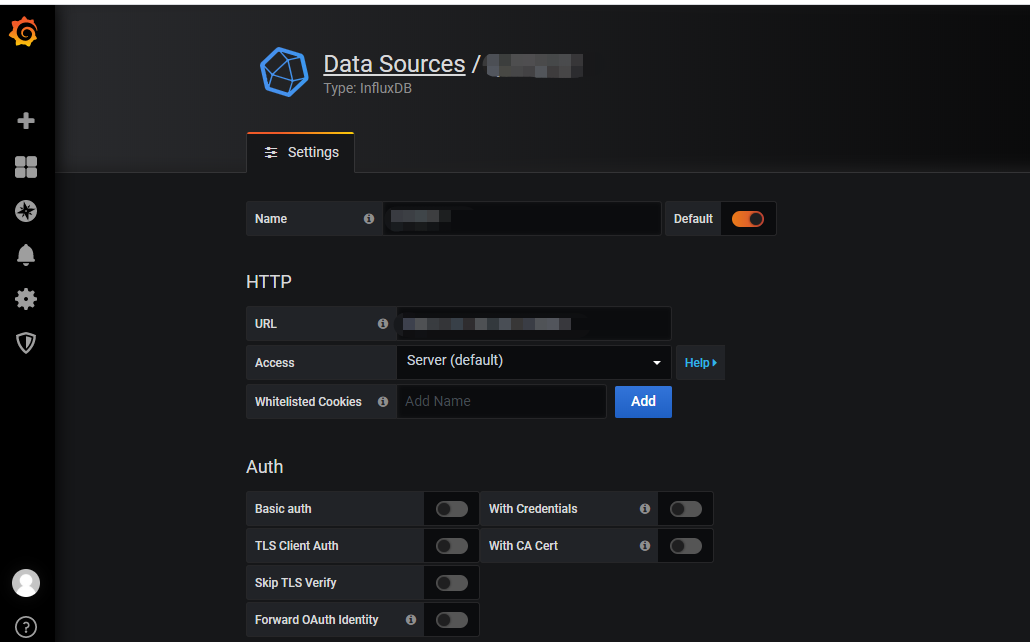
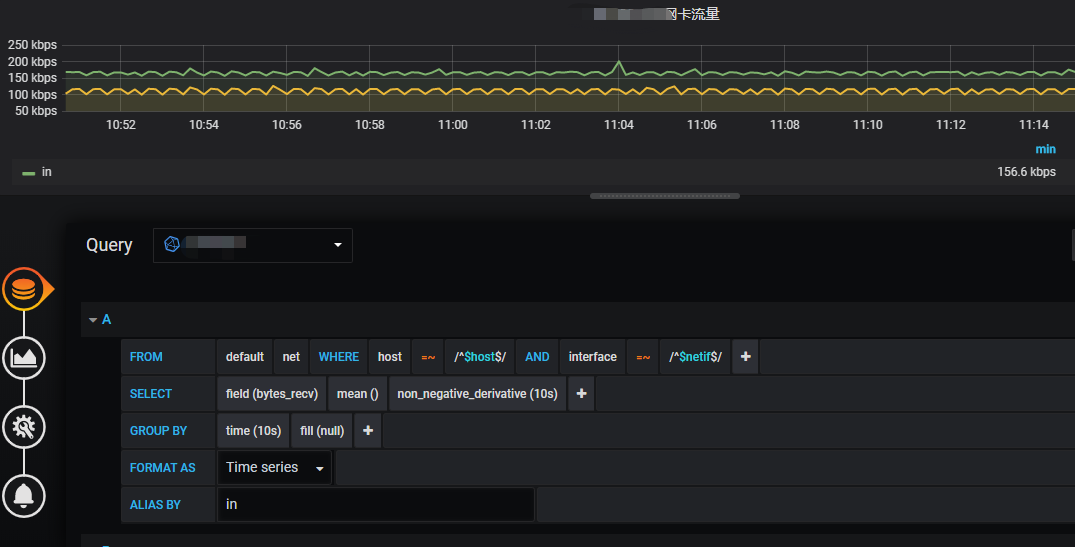
1、添加数据源

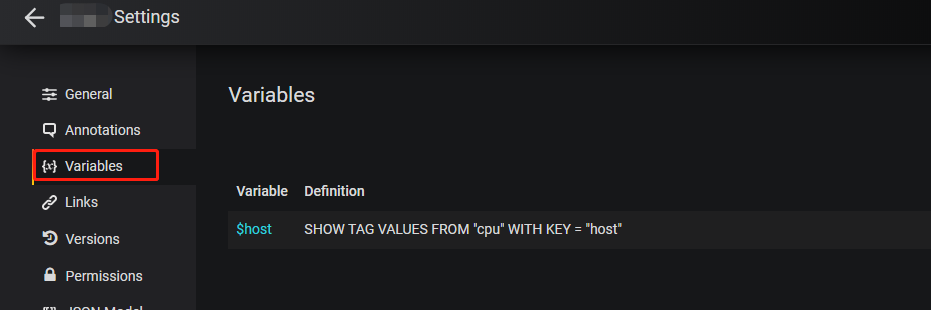
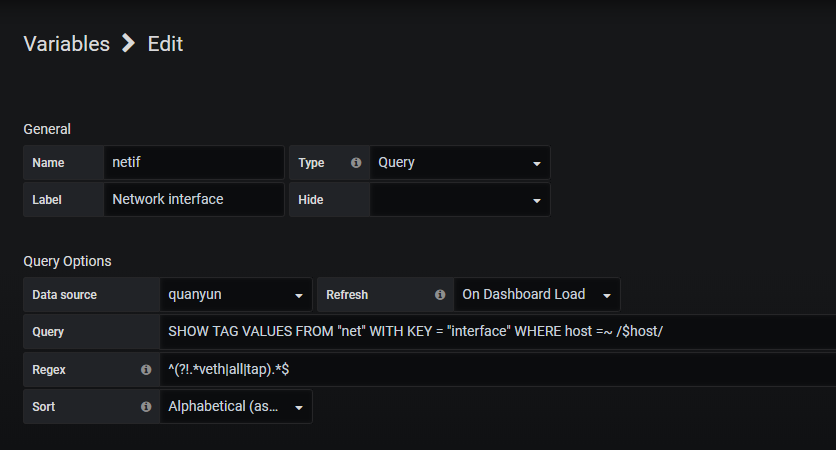
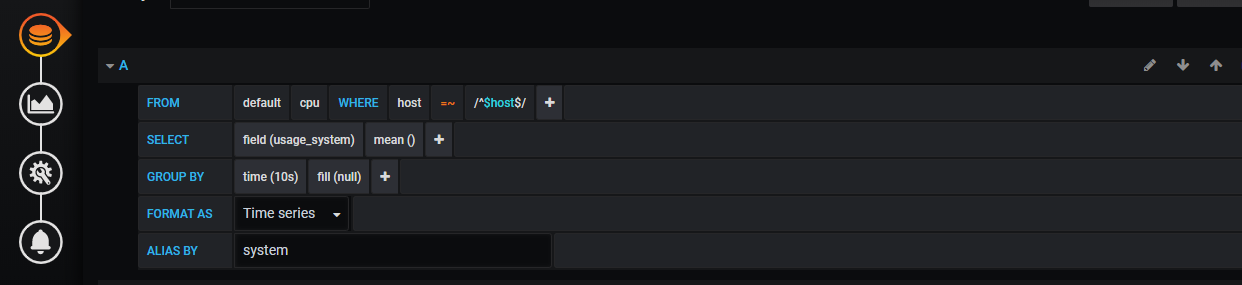
2、创建dashboard

 浙公网安备 33010602011771号