Echarts图使用
Author:Exchanges
Version:9.0.2
目录
一、Echarts概述
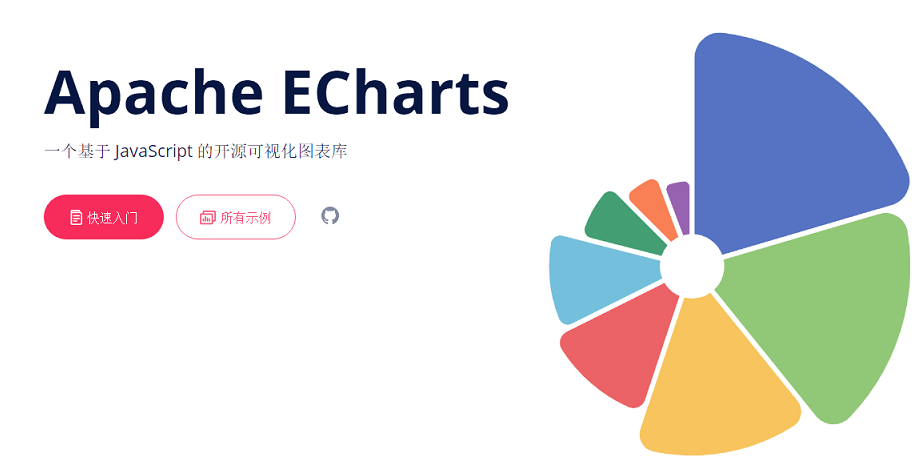
1.1 Echarts介绍
一个基于 JavaScript 的开源可视化图表库,百度开源,贡献给了Apache
1.2 Echarts官网
二、Echarts使用
2.1 两种方式引入js
<!-- <script src="js/echarts.min.js"></script>-->
<script src="https://cdn.jsdelivr.net/npm/echarts@5.1.2/dist/echarts.min.js"></script>
2.2 编写页面
<!DOCTYPE html>
<html>
  <head>
    <meta charset="utf-8" />
    <title>ECharts</title>
    <!-- 引入刚刚下载的 ECharts 文件 -->
    <script src="echarts.min.js"></script>
  </head>
  <body>
    <!-- 为 ECharts 准备一个定义了宽高的 DOM -->
    <div id="main" style="width: 600px;height:400px;"></div>
    <script type="text/javascript">
      // 基于准备好的dom,初始化echarts实例
      var myChart = echarts.init(document.getElementById('main'));

      // 指定图表的配置项和数据
      var option = {
        title: {
          text: 'ECharts 入门示例'
        },
        tooltip: {},
        legend: {
          data: ['销量']
        },
        xAxis: {
          data: ['衬衫', '羊毛衫', '雪纺衫', '裤子', '高跟鞋', '袜子']
        },
        yAxis: {},
        series: [
          {
            name: '销量',
            type: 'bar',
            data: [5, 20, 36, 10, 10, 20]
          }
        ]
      };

      // 使用刚指定的配置项和数据显示图表。
      myChart.setOption(option);
    </script>
  </body>
</html>
访问页面测试即可!
2.3 后台模拟数据访问
前端页面
<!DOCTYPE html>
<html>
<head>
    <meta charset="utf-8" />
    <title>ECharts</title>
    <!-- 引入刚刚下载的 ECharts 文件 -->
<!--    <script src="js/echarts.min.js"></script>-->
    <script src="https://cdn.jsdelivr.net/npm/echarts@5.1.2/dist/echarts.min.js"></script>
</head>

<!-- 导入Jquery.js -->
<script src="https://ajax.aspnetcdn.com/ajax/jquery/jquery-3.5.1.min.js"></script>

<body>
<!-- 为 ECharts 准备一个定义了宽高的 DOM -->
<div id="main" style="width: 600px;height:400px;"></div>
<script type="text/javascript">
    // 基于准备好的dom,初始化echarts实例
    var myChart = echarts.init(document.getElementById('main'));

    // 指定图表的配置项和数据
    var option = {
        title: {
            text: 'ECharts 入门示例'
        },
        tooltip: {},
        legend: {
            data: ['销量']
        },
        xAxis: {
            //data: ['衬衫', '羊毛衫', '雪纺衫', '裤子', '高跟鞋', '袜子']
        },
        yAxis: {},
        series: [
            // {
            //     name: '销量',
            //     type: 'bar',
            //     data: [5, 20, 36, 10, 10, 20]
            // }
        ]
    };

    // 使用刚指定的配置项和数据显示图表。
    //myChart.setOption(option);

    //ajax网络请求
    $.get("index/getData",function(res){
        alert(res)
            option.xAxis.data = res.className;
            option.series = res;
            myChart.setOption(option);
    })

</script>
</body>
</html>
后台代码
POJO
package com.qf.pojo;

import lombok.AllArgsConstructor;
import lombok.Data;
import lombok.NoArgsConstructor;

@Data
@AllArgsConstructor
@NoArgsConstructor
public class DemoData {

    //种类
    private String [] className;

    //返回给前端的json类型,名称要和前端保持一致
    private String name;
    private String type;
    //数据
    private Integer [] data;

}
Controller
package com.qf.controller;

import com.qf.pojo.DemoData;
import org.springframework.web.bind.annotation.RequestMapping;
import org.springframework.web.bind.annotation.RestController;

@RestController
@RequestMapping("index")
public class IndexController {

    @RequestMapping("getData")
    public DemoData getData(){

        DemoData demoData = new DemoData();
        demoData.setClassName(new String[]{"手机","电脑","平板","音响","键盘","鼠标"});
        //和前端legend中的data对应的名称保持一致
        demoData.setName("销量");
        demoData.setType("bar");
        demoData.setData(new Integer[]{10,20,30,40,50,60});

        return demoData;
    }
}
2.4 Echarts的配置项
参考配置:https://echarts.apache.org/zh/option.html#title
核心常用:
1.title 标题组件
2.legend 图例组件
3.xAxis 直角坐标系 grid 中的 x 轴
4.yAxis 直角坐标系 grid 中的 y 轴
5.series 系列列表。每个系列通过 type 决定自己的图表类型,为y轴设置数据
6.toolbox 工具栏。内置有导出图片,数据视图,动态类型切换,数据区域缩放,重置五个工具
7.tooltip 提示框组件
三、饼图自定义样式案例演示
3.1 前端页面
pie.html
<!DOCTYPE html>
<html>
<head>
    <meta charset="utf-8" />
    <title>ECharts</title>
    <!-- 引入刚刚下载的 ECharts 文件 -->
    <!--    <script src="js/echarts.min.js"></script>-->
    <script src="https://cdn.jsdelivr.net/npm/echarts@5.1.2/dist/echarts.min.js"></script>
</head>

<!-- 导入Jquery.js -->
<script src="https://ajax.aspnetcdn.com/ajax/jquery/jquery-3.5.1.min.js"></script>

<body>
<div id="main" style="width: 600px;height:400px;"></div>
</body>
<script>
    var chartDom = document.getElementById('main');
    var myChart = echarts.init(chartDom);
    var option;

    option = {
        backgroundColor: '#2c343c',
        title: {
            text: 'Customized Pie',
            left: 'center',
            top: 20,
            textStyle: {
                color: '#ccc'
            }
        },
        tooltip: {
            trigger: 'item'
        },
        visualMap: {
            show: false,
            min: 80,
            max: 600,
            inRange: {
                colorLightness: [0, 1]
            }
        },
        series: [
            {
                name: 'Access From',
                type: 'pie',
                radius: '55%',
                center: ['50%', '50%'],
                data: [
                    { value: 335, name: 'Direct' },
                    { value: 310, name: 'Email' },
                    { value: 274, name: 'Union Ads' },
                    { value: 235, name: 'Video Ads' },
                    { value: 400, name: 'Search Engine' }
                ].sort(function (a, b) {
                    return a.value - b.value;
                }),
                roseType: 'radius',
                label: {
                    color: 'rgba(255, 255, 255, 0.3)'
                },
                labelLine: {
                    lineStyle: {
                        color: 'rgba(255, 255, 255, 0.3)'
                    },
                    smooth: 0.2,
                    length: 10,
                    length2: 20
                },
                itemStyle: {
                    color: '#c23531',
                    shadowBlur: 200,
                    shadowColor: 'rgba(0, 0, 0, 0.5)'
                },
                animationType: 'scale',
                animationEasing: 'elasticOut',
                animationDelay: function (idx) {
                    return Math.random() * 200;
                }
            }
        ]
    };

    //ajax网络请求
    $.ajax({
        url:'pie/getData',
        async: false,
        dataType: 'json',
        success: function(res) {
            option.series[0].data = res;
        }
    })

    myChart.setOption(option);

</script>
</html>
3.2 后端代码
POJO
package com.qf.pojo;

import lombok.AllArgsConstructor;
import lombok.Data;
import lombok.NoArgsConstructor;

import java.math.BigDecimal;

@Data
@AllArgsConstructor
@NoArgsConstructor
public class Pie {
    private String name;
    private BigDecimal value;
}
Controller
package com.qf.controller;

import com.qf.pojo.Pie;
import org.springframework.web.bind.annotation.GetMapping;
import org.springframework.web.bind.annotation.RequestMapping;
import org.springframework.web.bind.annotation.RestController;

import java.math.BigDecimal;
import java.util.Arrays;
import java.util.List;

@RestController
@RequestMapping("pie")
public class PieController {

    @GetMapping("getData")
    public Object getData() {
        List<Pie> pieList = Arrays.asList(
                new Pie("鞋子", BigDecimal.valueOf(5677.01)),
                new Pie("电脑", BigDecimal.valueOf(5892.89)),
                new Pie("手机", BigDecimal.valueOf(8098.34)),
                new Pie("书籍", BigDecimal.valueOf(9087.23))
        );
        return pieList;
    }
}

 浙公网安备 33010602011771号