# -*- coding=utf-8 -*-
import matplotlib
import matplotlib.pyplot as plt
from io import BytesIO
import base64
import matplotlib.patches as mpatches
import time
def render_picture(xlist, ylist, debugflag=False):
"""样式"""
plt.rcParams['font.family']=['Microsoft YaHei']
if not debugflag:
matplotlib.use('Agg') #绘图开关
patch = mpatches.Patch(color='blue', label='IPhoneX')
plt.legend(handles=[patch])
now = time.strftime("%Y-%m-%d %H:%M:%S", time.localtime())
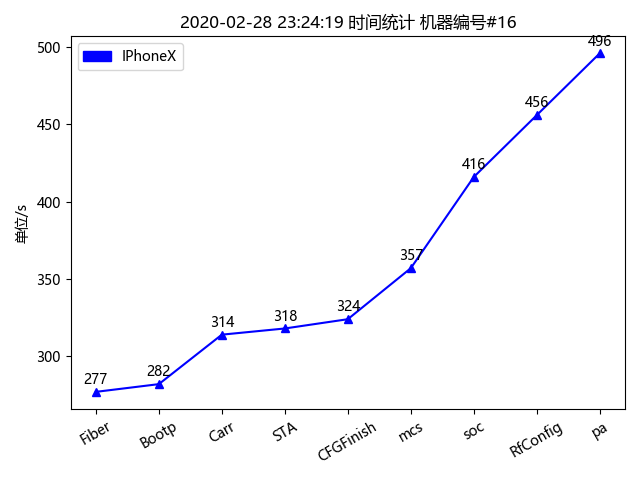
plt.title('%s 时间统计 机器编号#16'%now)
#保证x与y能够对齐
minlen = min(len(xlist), len(ylist))
plt.tick_params(axis='x', rotation=30)
plt.plot(xlist[:minlen], ylist[:minlen], 'b-^')
plt.ylabel('单位/s')
"""数值显示"""
for x,y in list(zip(xlist[:minlen], ylist[:minlen])):
plt.text(x, y+5, y, ha='center', va='baseline')
"""转换为html"""
sio = BytesIO()
plt.savefig(sio, format='png')
data = base64.encodebytes(sio.getvalue()).decode()
html = '''
<html>
<body>
<img src="data:image/png;base64,{}" />
</body>
<html>
'''.format(data)
if debugflag:
plt.show()
plt.close()
return html
if "__main__" == __name__:
"""数据"""
xlist = ['Fiber', 'Bootp', 'Carr', 'STA',
'CFGFinish', 'mcs', 'soc', 'RfConfig',
'pa', ]
ylist = [277, 282, 314, 318,
324, 357, 416, 456,
496]
print(render_picture(xlist,ylist,True))

 浙公网安备 33010602011771号