基于Python进行小波分析
在气象学和环境科学的研究中,理解和预测气象数据的周期性变化至关重要。小波分析作为一种高效的数学工具,近年来在气象数据的周期性分析中得到了广泛应用。本文将详细介绍如何通过Python进行小波分析,以探究气象数据中的周期性变化。
1 数据来源及下载方式
西北农林科技大学的彭守璋研究员在国家青藏高原科学数据中心公开发布了气温、降水、干燥度等气象数据,本文所使用的数据为基于其中的 中国1km分辨率逐月降水量数据集 转换得到的某地区历年降水量数据,可通过FTP进行下载。
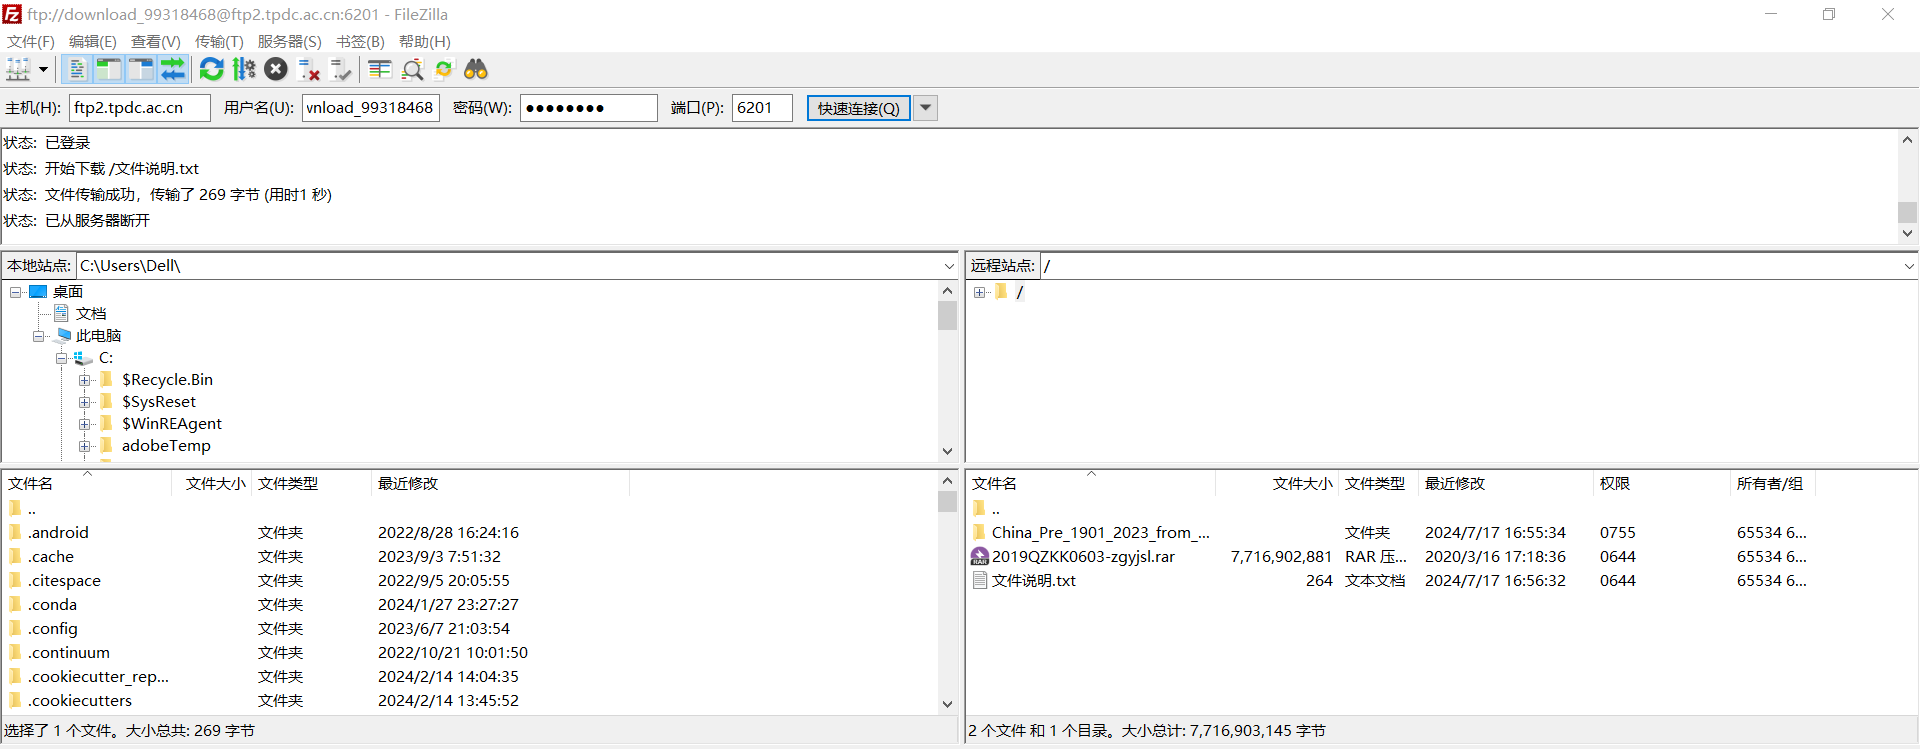
以 Filezilla 桌面版软件为例,输入官网中给定的主机号、用户名、密码、端口等信息后即可将数据从远程站点下载至本地。

2 代码编写
2.1 导入相关模块
import openpyxl
import pywt
import numpy as np
import pandas as pd
import matplotlib.pyplot as plt
from matplotlib import rcParams
2.2 设置地图字体及字号
config = {
    "mathtext.fontset": "stix",
    "font.family": "serif",
    "font.serif": ["Times New Roman"],
    "font.size": 24,
    "axes.unicode_minus": False # 处理负号,即-号
}
rcParams.update(config)
2.3 从Excel表读取数据
# 通过pandas模块读取Excel表,并提取表格中的年份及降水量数据
file_path = "file_path"	# 此处为Excel文件路径
data = pd.read_excel(file_path)
Year_list = list(data["Year"])
Pre_list = list(data["Pre"])
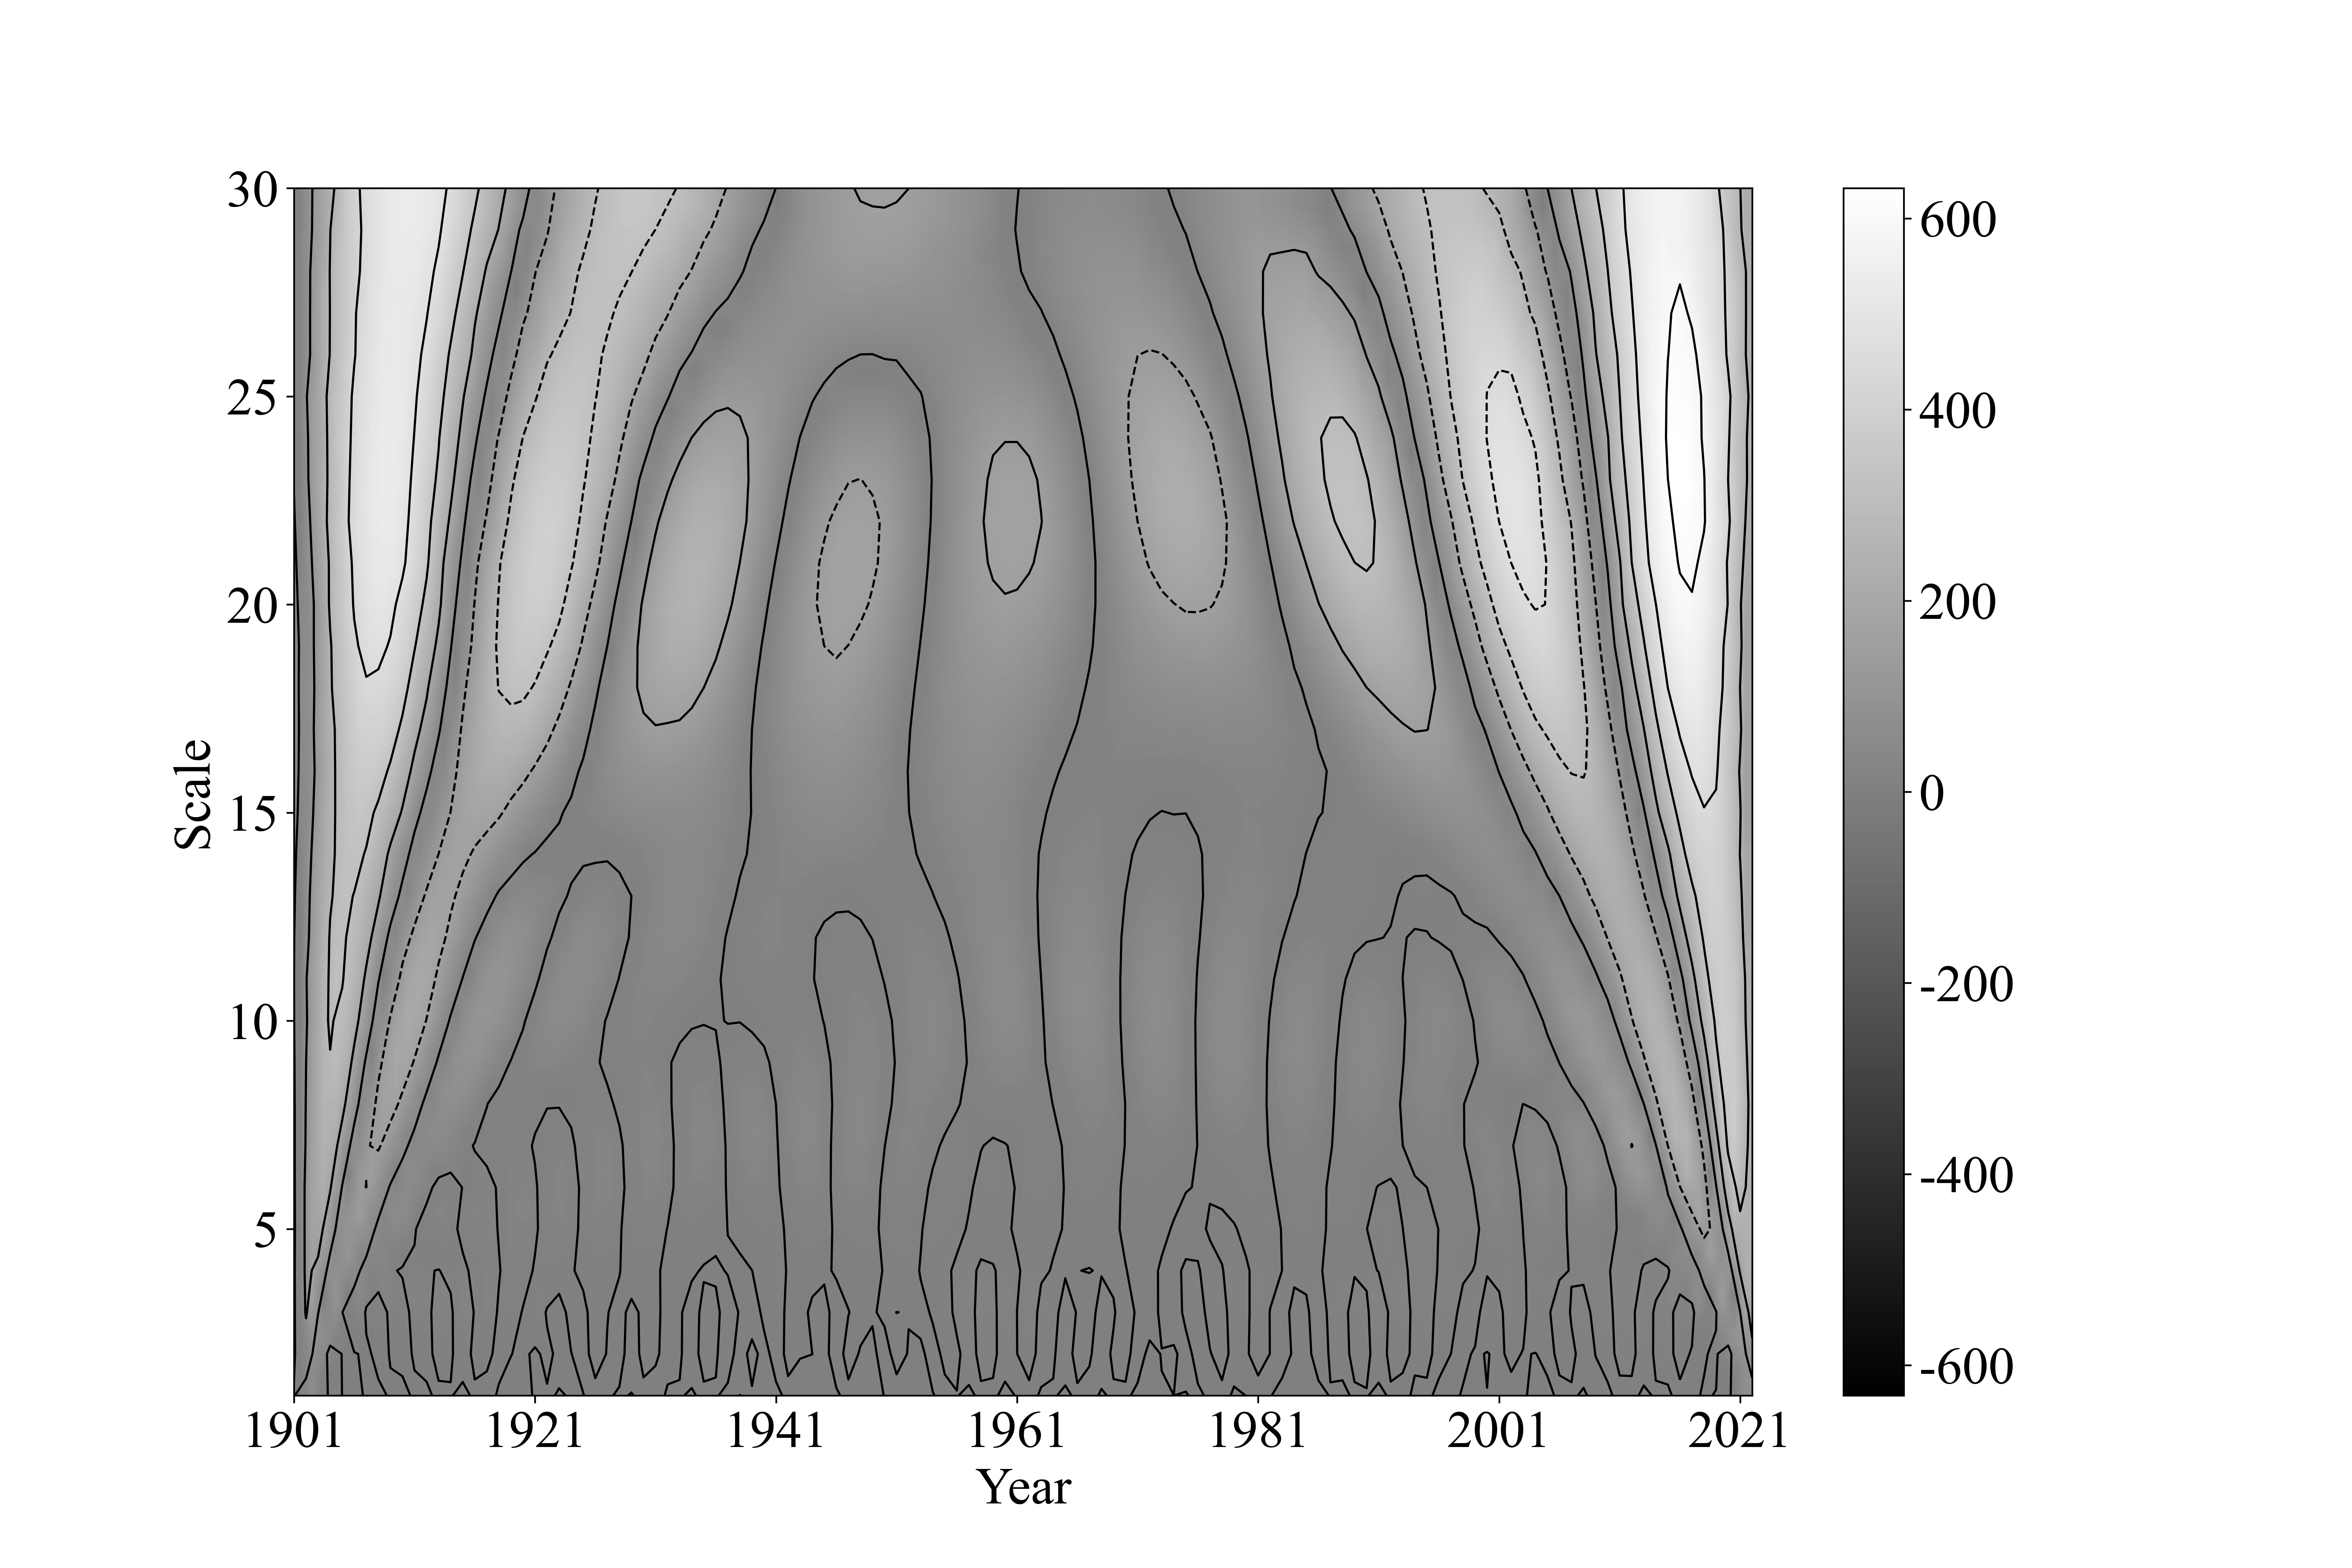
2.4 进行小波变换,绘制小波等值线图
scales = np.arange(1, 31)	# 设置小波分析的时间尺度
coef, freqs = pywt.cwt(Pre_list, scales, "morl")	# 对降水量数据进行Morlet小波变换

fig, ax = plt.subplots(figsize=(15, 10))

# 绘制小波系数图像
im = plt.imshow(abs(coef), extent=[Year_list[0], Year_list[-1], 30, 1],
                interpolation="bilinear", cmap="gray", aspect="auto",
                vmax=abs(coef).max(), vmin=-abs(coef).max())
plt.colorbar(im, ax=ax)  # 添加色带图例

# 绘制小波系数等值线
contour = plt.contour(Year_list, scales, coef.real, colors="black", linewidths=1)

ax.invert_yaxis()   # 反转Y轴,使时间尺度从大到小排列
ax.set_xticks(np.arange(1901, 2024, 20))
ax.set_yticks(np.arange(5, 31, 5))
ax.set_xlabel("Year")
ax.set_ylabel("Scale")
fig.savefig("小波等值线图.jpg", dpi=600)
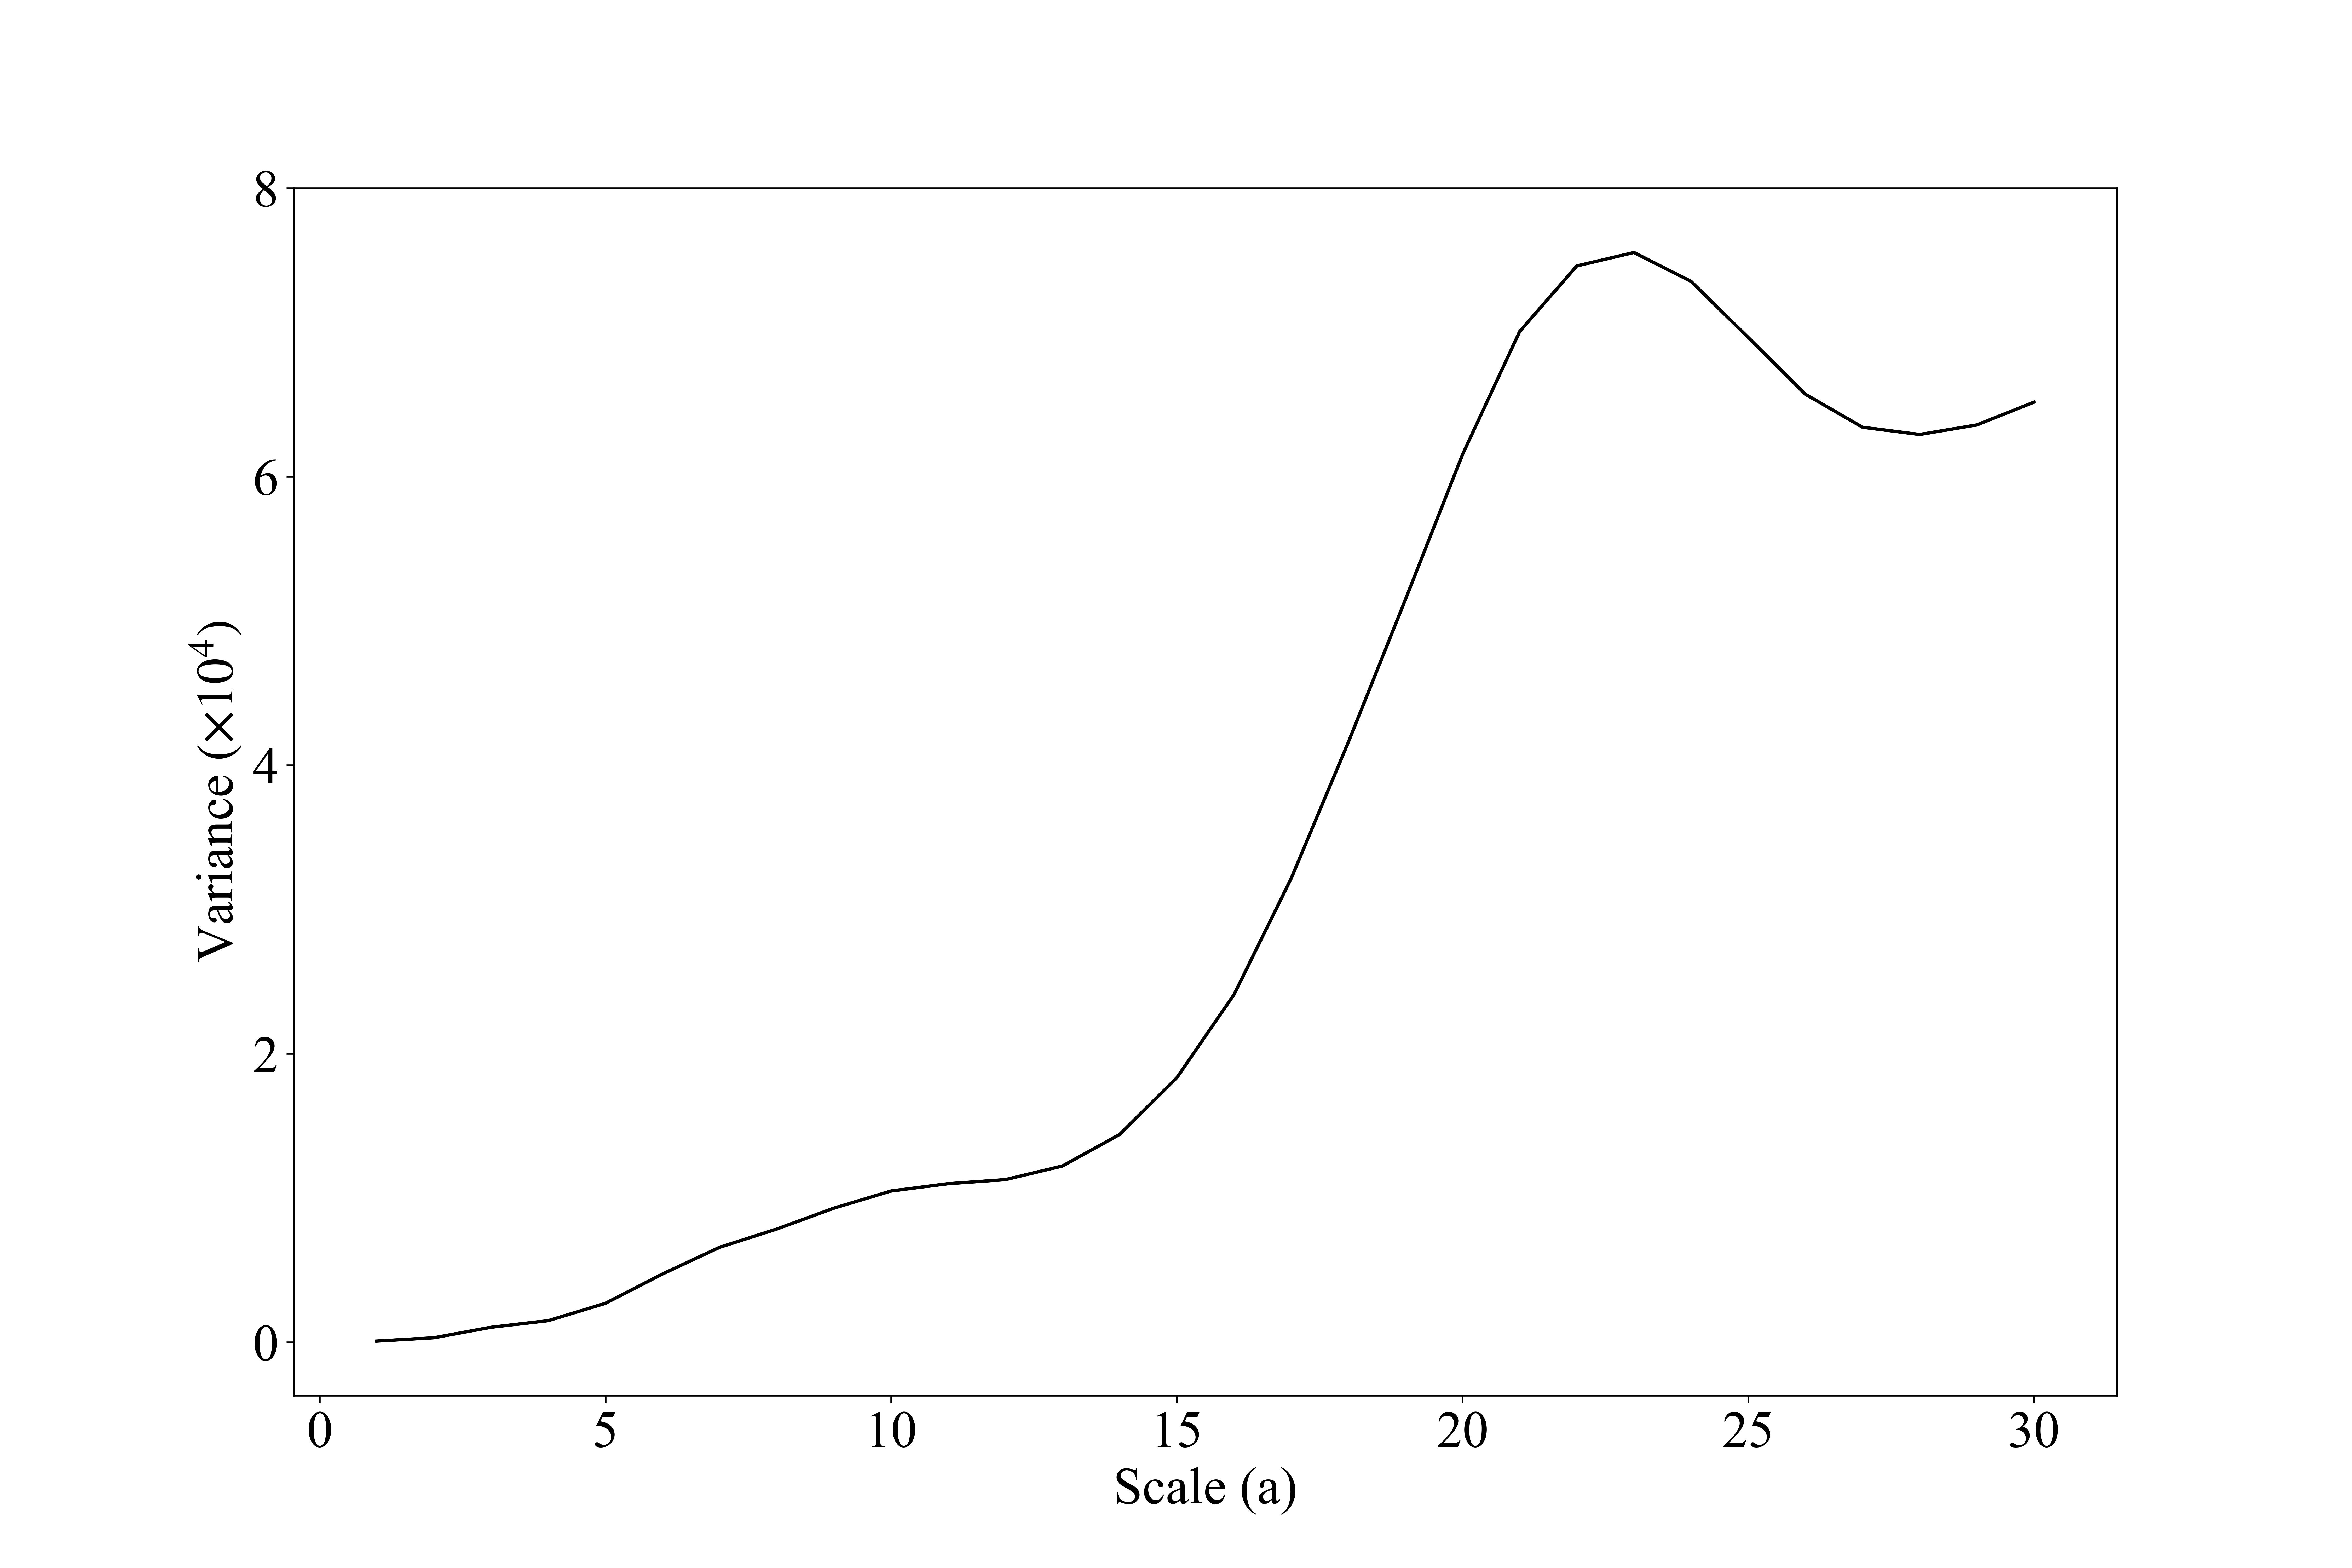
2.5 计算小波方差,绘制小波方差图
variance = np.var(coef, axis=1)	# 计算小波方差
variance1 = variance / 10000	# 数值较大,将数值缩小10000倍后显示在结果图中


fig, ax = plt.subplots(figsize=(15, 10))

ax.plot(scales, variance1, "k-")	# 绘制方差曲线
ax.set_xlabel("Scale (a)")
# \times为LaTeX语法中的叉乘号
# 在Python中,反斜杠"\"为转义字符,此处需同时输入两个反斜杠
ax.set_ylabel("Variance $\mathrm{(\\times 10^4)}$")
ax.set_xticks(np.arange(0, 31, 5))
ax.set_yticks(np.arange(0, 9, 2))
fig.savefig("小波方差图.jpg", dpi=600)
3 等值线及方差图示例


4 降水数据参考文献格式
4.1 数据的引用
彭守璋. (2020). 中国1km分辨率逐月降水量数据集(1901-2023). 国家青藏高原数据中心. https://doi.org/10.5281/zenodo.3114194.
Peng, S. (2020). 1-km monthly precipitation dataset for China (1901-2023). National Tibetan Plateau / Third Pole Environment Data Center. https://doi.org/10.5281/zenodo.3114194.
4.2 文章的引用
1、Peng, S.Z., Ding, Y.X., Wen, Z.M., Chen, Y.M., Cao, Y., & Ren, J.Y. (2017). Spatiotemporal change and trend analysis of potential evapotranspiration over the Loess Plateau of China during 2011-2100. Agricultural and Forest Meteorology, 233, 183-194. https://doi.org/10.1016/j.agrformet.2016.11.129
2、Ding, Y.X., & Peng, S.Z. (2020). Spatiotemporal trends and attribution of drought across China from 1901–2100. Sustainability, 12(2), 477.
3、Peng, S.Z., Ding, Y.X., Liu, W.Z., & Li, Z. (2019). 1 km monthly temperature and precipitation dataset for China from 1901 to 2017. Earth System Science Data, 11, 1931–1946. https://doi.org/10.5194/essd-11-1931-2019
4、Peng, S., Gang, C., Cao, Y., & Chen, Y. (2017). Assessment of climate change trends over the loess plateau in china from 1901 to 2100. International Journal of Climatology.


