iOS 图表工具charts之CombinedChartView
关于charts的系列视图介绍传送门:
iOS 图表工具charts介绍
iOS 图表工具charts之LineChartView
iOS 图表工具charts之BarChartView
iOS 图表工具charts之PieChartView
iOS 图表工具charts之CandleStickChartView
iOS 图表工具charts之CombinedChartView
CombinedChartView在charts中可以用来绘制组合图,即前面介绍的所有图标的组合形态,通过CombinedChartView可以设置各种图表的图层,由于charts是基于swift开发的,如果需要和objective-C混编(通过pod的方式不用管),可以参考我的上几篇文章iOS OC中桥接swift第三方库》,这里主要讲的是CombinedChartView的一些常用属性和一些基本用法,实际情况以开发为准

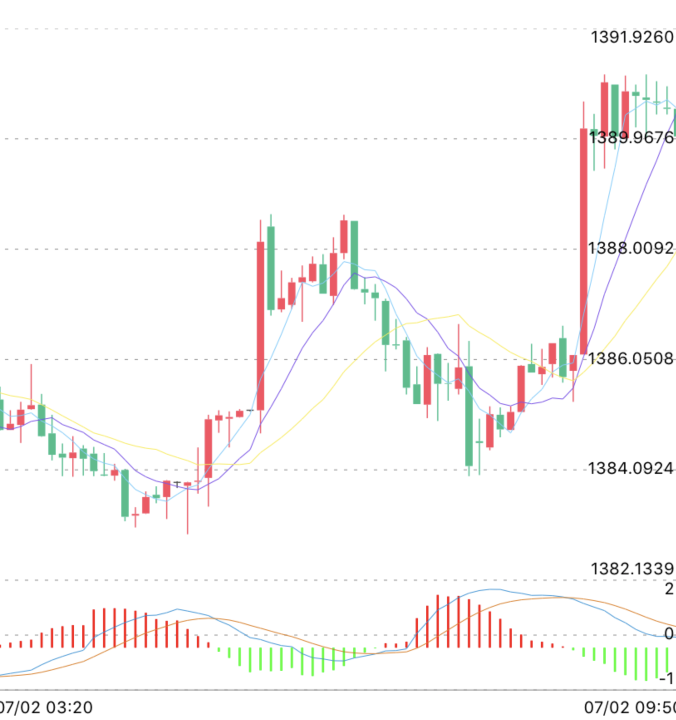
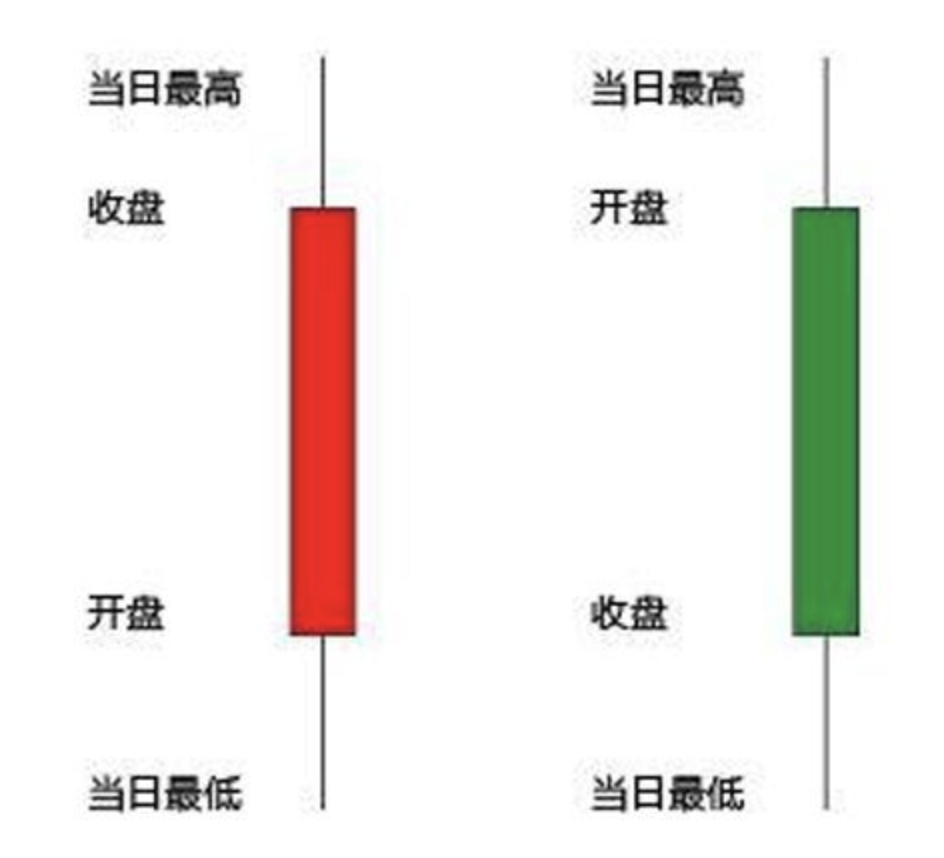
关于K线,我们知道K线能反应一只股票的实时状态以及涨跌幅度的一种图表,K线主要是又4组数组组成的,分别是开盘价,收盘价,最高价,最低价

K线上面的每根柱子都是有这4组数据按照一定的比例画出来的,charts中就提供了一种绘制k线的视图,CombinedChartView,我们如果需要画出k线柱子,只需要传入这4个价格即可,对应的红色还是绿色可以自行设置红涨绿跌或者绿涨红跌
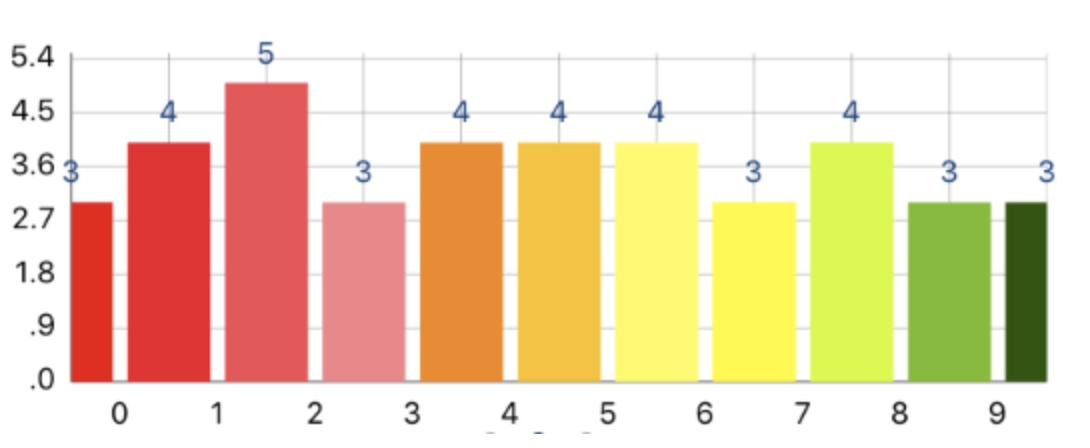
组合图可以包含之前介绍的所有图表,这些图表能够同时显示在CombinedChartView中,在CombinedChartView中可以通过drawOrder来设置层级关系
    //设置层级
    chartView.drawOrder = @[
                            @(CombinedChartDrawOrderBar),
                            @(CombinedChartDrawOrderBubble),
                            @(CombinedChartDrawOrderCandle),
                            @(CombinedChartDrawOrderLine),
                            @(CombinedChartDrawOrderScatter)
                            ];
CombinedChartView的属性基本同之前介绍的属性差不多,有需要的可以回到前面几篇文章查看,基本都是一些缩放比例,显示个数,图例,捏合手势,是否滚动,是否网格,label个数,字体大小颜色线宽,xAxis,leftAxis,RightAxis等等,前面都已经介绍的很详细了,这里就不在累述了
给CombinedChartView赋值
    CombinedChartData *chartData = [[CombinedChartData alloc] init];
    chartData.candleData = candleData;
    chartData.lineData = lineData;
    chartData.barData = barData;
    self.chartView.data = chartData;
我们需要做的就是分别根据datas初始化对应的candleData,lineData,barData数据了
关于怎么创建candleData请参考iOS 图表工具charts之CandleStickChartView
关于怎么创建lineData请参考iOS 图表工具charts之LineChartView
关于怎么创建barData请参考iOS 图表工具charts之BarChartView
创建完数据之后直接将数据赋值给CombinedChartData即可,这里lineData,barData,candleData可以为nil,但是呢不能全部为nil,如果这些数据全部为nil可以设置self.chartView.data=nil,而不要self.chartView.data = chartData(chartData至少有一组数据是可行的,否则会崩溃); 还有lineData是可以放多条线的,之前讲lineChartView的时候应该是有讲过的,如果记不清了,请回头看一下,谢谢
一个完整的k线是有上半边k线图(chartView),和下半边指数图组成的(subChartView),需要注意的
1.滚动一般都是同步的,也是上边的chartView滚动,下边的subChartView也要跟着滚动
#pragma mark 图表被移动
-(void)chartTranslated:(ChartViewBase *)chartView dX:(CGFloat)dX dY:(CGFloat)dY{
    CGAffineTransform srcMatrix = chartView.viewPortHandler.touchMatrix;
    [self.chartView.viewPortHandler refreshWithNewMatrix:srcMatrix chart:self.chartView invalidate:YES];
    [self.subChartView.viewPortHandler refreshWithNewMatrix:srcMatrix chart:self.subChartView invalidate:YES];
}
2.缩放是同步的,初始缩放比例,最大缩放比例,实时缩放比例必须是同步的
#pragma mark 图表被缩放
-(void)chartScaled:(ChartViewBase *)chartView scaleX:(CGFloat)scaleX scaleY:(CGFloat)scaleY{
    CGAffineTransform srcMatrix = chartView.viewPortHandler.touchMatrix;
    [self.chartView.viewPortHandler refreshWithNewMatrix:srcMatrix chart:self.chartView invalidate:YES];
    [self.subChartView.viewPortHandler refreshWithNewMatrix:srcMatrix chart:self.subChartView invalidate:YES];
}
3.点击了实时显示当前选中值的价格面板,找到选中的model,并将model传递出去

//k线代理方法
-(void)chartValueSelected:(ChartViewBase *)chartView entry:(ChartDataEntry *)entry highlight:(ChartHighlight *)highlight{
     NSInteger index = highlight.x;
    //index为当前选中的x值
    if(index  < self.datas.count){
        //根据当前的index能拿到对应的数据模型
        Model *model = self.datas[index];
    }
}
4.CombinedChartView显示组合图的时候会出现第一个和最后一个图会显示一半(显示不全),如果你遇到这样的问题,下面这种方法可以解决你的问题
 =
=
参考github Charts issues:https://github.com/danielgindi/Charts/issues/2106
    ChartXAxis *xAxis = chartView.xAxis;
    //这个很重要 可以解决显示半个bar的bug
    xAxis.spaceMin = 0.5;
    xAxis.spaceMax = 0.5;
5.画折线
      UIColor *color = colors[idx];
      [set setColor:color];
      set.lineWidth = 0.5;
      set.drawCirclesEnabled = NO;
      set.drawValuesEnabled = NO;
      set.axisDependency = AxisDependencyRight;
      set.highlightEnabled = NO;
      set.drawHorizontalHighlightIndicatorEnabled = NO;
      set.drawVerticalHighlightIndicatorEnabled = NO;
      set.mode = LineChartModeLinear;
6.画空心线
       [set setColor:[UIColor clearColor]];
       set.lineWidth = 0.5;
       set.drawCirclesEnabled = YES;
       set.circleRadius = 2.5f;
       set.circleColors = @[UIColor.redColor];
       set.circleHoleColor = [UIColor clearColor];
       set.circleHoleRadius = 2.0f;
       set.drawCircleHoleEnabled = YES;
       set.lineDashPhase = .5f;
       set.lineDashLengths = @[@.5f];
       set.drawValuesEnabled = NO;
       set.axisDependency = AxisDependencyRight;
       set.highlightEnabled = NO;
       set.drawHorizontalHighlightIndicatorEnabled = NO;
       set.drawVerticalHighlightIndicatorEnabled = NO;
       set.mode = LineChartModeLinear;
7.柱状图
       BarChartDataSet *set = [[BarChartDataSet alloc] initWithEntries:entrys label:setName];
        //设置set属性
        set.axisDependency = AxisDependencyRight;
        set.formLineWidth = 5;
        set.highlightEnabled = NO;
        [set setColors:colors];
        [data addDataSet:set];
8.K线
   CandleChartDataSet *set = [[CandleChartDataSet alloc] initWithEntries:array label:@"kLine DataSet"];
    //下降颜色 是否填充填充
    set.decreasingColor = UIColorHex(0x32BE89);
    set.decreasingFilled = YES;
    //上升颜色 是否填充填充
    set.increasingColor = UIColorHex(0xFD4C60);
    set.increasingFilled = YES;
    //显示美国线
    //set.showCandleBar = NO;
    //阴影线的宽度 颜色跟随
    set.shadowWidth = 0.7;
    set.shadowColorSameAsCandle = YES;
    //k线柱间隙
    set.barSpace = 0.15;
    //是否现在十字标识
    set.drawHorizontalHighlightIndicatorEnabled = NO;
    set.drawVerticalHighlightIndicatorEnabled = NO;
    //轴线方向
    set.axisDependency = AxisDependencyRight;
    //不显数字
    set.drawValuesEnabled = NO;
9.有时候可以画一些透明的线用来占位置
    //set
    LineChartDataSet *lineSet = [[LineChartDataSet alloc] initWithEntries:listEntry label:@"Line DataSet x"];
    [lineSet setColor:UIColor.clearColor];
    lineSet.drawValuesEnabled = NO;
    lineSet.drawCirclesEnabled = NO;
    lineSet.drawHorizontalHighlightIndicatorEnabled = NO;
    lineSet.drawVerticalHighlightIndicatorEnabled = NO;
    //不可以被点击
    lineSet.highlightEnabled = NO;
10.其他关于K线需要注意的点请参考iOS 图表工具charts之CandleStickChartView中需要注意的点
11.如果指标图为MACD的情况下,需要保证bar的个数和K线的bar个数一样多,都在会出现上下两个bar中心点不一样的情况 如果不同可以使用填充数据的方式,让后填充的数据用透明颜色
其他待续


