Python+Opencv3:一、图像变换(几何变换、阈值操作)
这里需要掌握的是图像的几何形态的转化,如平移、旋转、透视等,熟练的对图像进行转化,为下一步图像处理做基础。
1、图像平移
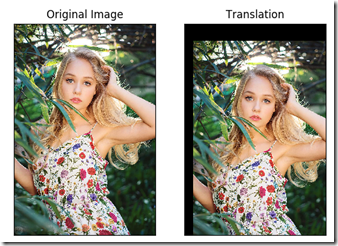
平移就是将对象换一个位置。如果你要沿(x,y)方向移动,移动的距离是(t x ,t y ),你可以以下面的方式构建移动矩阵:

你可以使用 Numpy 数组构建这个矩阵(数据类型是 np.float32),然后把它传给函数 cv2.warpAffine()。
import cv2
import numpy as np
from matplotlib import pyplot as plt
import math

'''
平移
'''

img =cv2.imread('/home/zxl/Downloads/timg.jpeg')
img=cv2.cvtColor(img,cv2.COLOR_RGB2BGR)
rows,cols,channels = img.shape
M = np.float32([[1,0,50],[0,1,100]])
dst = cv2.warpAffine(img,M,(cols,rows))
#警告:函数 cv2.warpAffine() 的第三个参数的是输出图像的大小,它的格式应该是图像的(宽,高)。应该记住的是图像的宽对应的是列数,高对应的是行数。

titles = ['Original Image', 'Translation']
images = [img, dst]

for i in range(2):
    plt.subplot(1,2,i+1),plt.imshow(images[i],'gray')
    plt.title(titles[i])
    plt.xticks([]),plt.yticks([])
plt.show()
2、图像旋转
对一个图像旋转角度 θ, 需要使用到下面形式的旋转矩阵。

但是 OpenCV 允许你在任意地方进行旋转,但是旋转矩阵的形式应该修改为

其中:

为了构建这个旋转矩阵,OpenCV 提供了一个函数:cv2.getRotationMatrix2D。
'''
旋转
'''

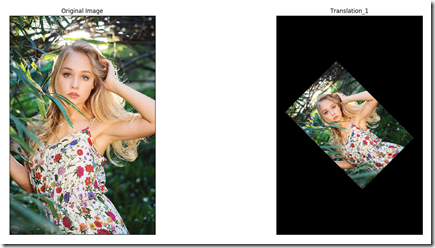
M_trans = cv2.getRotationMatrix2D((cols/2,rows/2),45,0.5)
dst_trans = cv2.warpAffine(img,M_trans,(cols,rows))

titles = ['Original Image', 'Translation_1']
images = [img, dst_trans]
for i in range(2):
    plt.subplot(1,2,i+1),plt.imshow(images[i],'gray')
    plt.title(titles[i])
    plt.xticks([]),plt.yticks([])
plt.show()
运行后效果(旋转后图像的尺寸发生变化,故将图像缩小显示):
3、仿射变换和透视变换
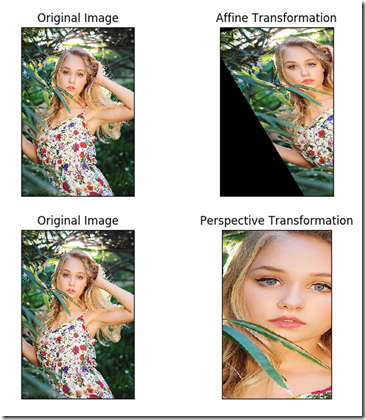
仿射变换中,原图中所有的平行线在结果图像中同样平行。为了创建这个矩阵我们需要从原图像中找到三个点以及他们在输出图像中的位置。然后cv2.getAffineTransform 会创建一个 2x3 的矩阵,最后这个矩阵会被传给函数 cv2.warpAffine。
透视变换,我们需要一个 3x3 变换矩阵。在变换前后直线还是直线。要构建这个变换矩阵,你需要在输入图像上找 4 个点,以及他们在输出图像上对应的位置。这四个点中的任意三个都不能共线。这个变换矩阵可以有函数 cv2.getPerspectiveTransform() 构建。然后把这个矩阵传给函数cv2.warpPerspective。
'''
仿射变换
'''

pos1 = np.float32([[50,50],[200,50],[50,200]])
pos2 = np.float32([[10,100],[200,50],[100,250]])

M_f = cv2.getAffineTransform(pos1,pos2)

dst_f = cv2.warpAffine(img,M_f,(cols,rows))

'''
透视变换(抠图?)
'''
pos1 = np.float32([[232,184],[540,184],[232,484],[540,484]])
pos2 = np.float32([[0,0],[308,0],[0,200],[308,200]])

#pts1 = np.float32([[56,65],[368,52],[28,387],[389,390]])
#pts2 = np.float32([[0,0],[300,0],[0,300],[300,300]])

#由于此处是四个点的转换、矩阵大小为3×3,需要使用getPerspectiveTransform

M_t = cv2.getPerspectiveTransform(pos1,pos2)

dst_t = cv2.warpPerspective(img,M_t,(200,308))

titles = ['Original Image', 'Affine Transformation','Original Image','Perspective Transformation']
images = [img, dst_f,img,dst_t]
for i in range(4):
    plt.subplot(2,2,i+1),plt.imshow(images[i],'gray')
    plt.title(titles[i])
    plt.xticks([]),plt.yticks([])
plt.show()
运行结果:
4、自适应阈值
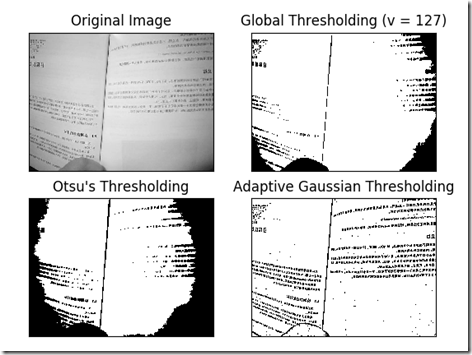
要对图像进行亮度分割时,势必会使用到阈值操作,例如设定一个阈值,高于阈值为255,低于阈值为0等。这时候需要用到的函数为cv2.threshold,但往往直接设定阈值会出现不准确的情况,尤其是当同一幅图像上的不同部分的具有不同亮度时。这种情况下我们需要采用自适应阈值。此时的阈值是根据图像上的每一个小区域计算与其对应的阈值。因此在同一幅图像上的不同区域采用的是不同的阈值,从而使我们能在亮度不同的情况下得到更好的结果。
'''
Otsu's thresholding after Gaussian filtering

主要是针对图像出现双峰的时候
'''
img_thresh = cv2.imread('theld.jpeg')
img_1 = cv2.cvtColor(img_thresh,cv2.COLOR_RGB2GRAY)
blur = cv2.GaussianBlur(img_1,(5,5),0)

ret,dst_thresh = cv2.threshold(blur,127,255,cv2.THRESH_BINARY)
ret_1,dst_thresh_1 = cv2.threshold(blur,0,255,cv2.THRESH_BINARY+cv2.THRESH_OTSU)

'''
自适应阈值
'''

dst_thresh_2 = cv2.adaptiveThreshold(blur,256,cv2.ADAPTIVE_THRESH_GAUSSIAN_C,cv2.THRESH_BINARY,11,2)

titles = ['Original Image', 'Global Thresholding (v = 127)',
            "Otsu's Thresholding", 'Adaptive Gaussian Thresholding']
images = [img_1, dst_thresh,dst_thresh_1,dst_thresh_2]
for i in range(4):
    plt.subplot(2,2,i+1),plt.imshow(images[i],'gray')
    plt.title(titles[i])
    plt.xticks([]),plt.yticks([])
plt.show()
运行后的效果:


