CS229 Machine Learning作业代码:Problem Set 1
牛顿法求解二分类逻辑回归参数
Repeat{
\(\theta:=\theta-H^{-1}\nabla_\theta l(\theta)\)
}
其中,Hessian矩阵\(H\in \mathbb R^{(n+1)\times (n+1)}\)
\[(H)_{i,j}=\frac {\partial^2J}{\partial \theta_i\partial \theta_j}
\]
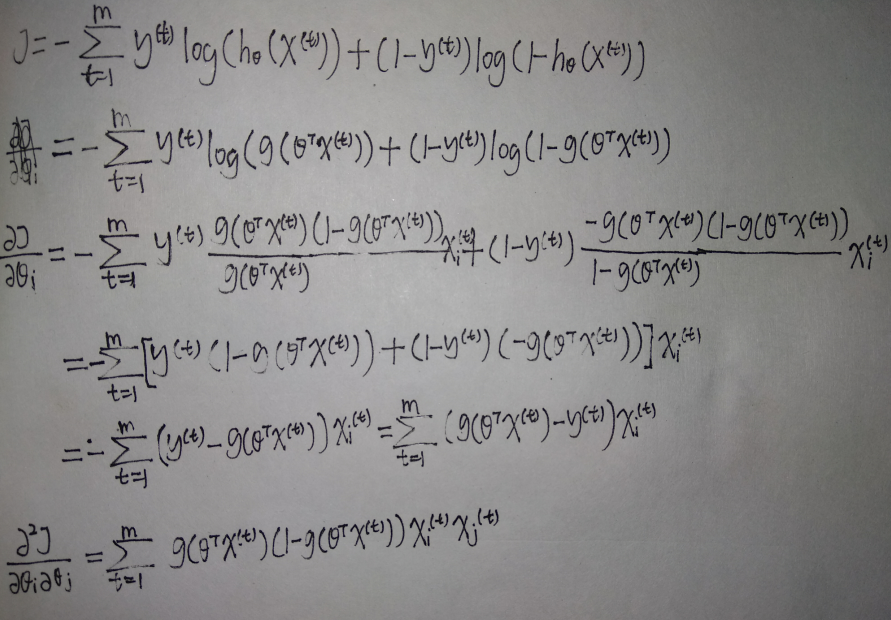
公式推导

代码
logistic_reg.m
clear;
close all;

%Plot the data
X=load("logistic_x.txt");
y=load("logistic_y.txt");

pos=find(y==1);
neg=find(y==-1);
figure();
plot(X(pos,1),X(pos,2),'bx');
hold on;
plot(X(neg,1),X(neg,2),'yo');
m=size(X,1);
n=size(X,2);
y(neg)=0;
X=[ones(m,1),X];

%logistic regression using Newton method
theta=zeros(n+1,1);

for it=1:10
    nabla=zeros(n+1,1);
    H=zeros(n+1,n+1); %hessian matrix
    J=0;
    for t=1:m
        tmp=sigmoid(X(t,:)*theta);
        J=J-(y(t)*log(tmp)+(1-y(t))*log(1-tmp));
    end
    J
    for t=1:m
        for i=1:n+1
            tmp=sigmoid(X(t,:)*theta);
            nabla(i)=nabla(i)+(tmp-y(t))*X(t,i);
        end
    end
    for t=1:m
        tmp=sigmoid(X(t,:)*theta);
        for i=1:n+1
            for j=1:n+1
                if(i>=j)
                    H(i,j)=H(i,j)+tmp*(1-tmp)*X(t,i)*X(t,j);
                else
                    H(i,j)=H(j,i);
                end
            end
        end
    end
    theta=theta-inv(H)*nabla;

    plotBoundary(X,theta);
end
plotBoundary.m
function plotBoundary(X,theta)
    plotx=[min(X(:,2))-2,max(X(:,2))+2];
    ploty=-(theta(1)+theta(2).*plotx)./theta(3);
    plot(plotx,ploty,'-');
end
sigmoid.m
function ans=sigmoid(x)
    ans=1.0/(1.0+exp(-x));
end
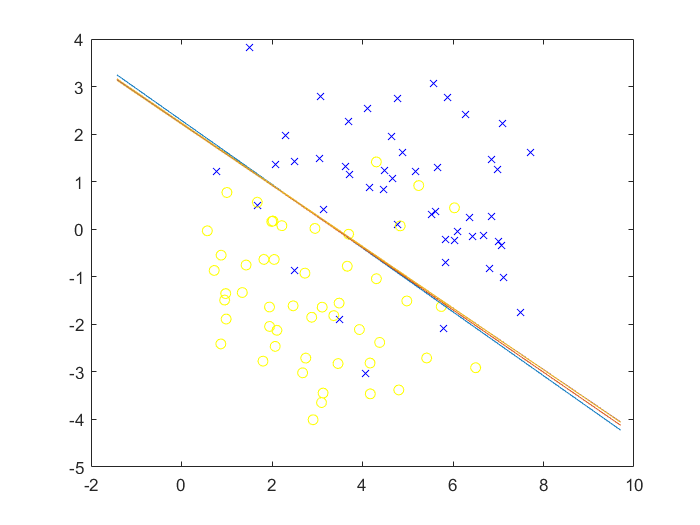
运行结果

局部加权线性回归
还是使用牛顿法拟合每个局部的直线。
公式推导
若当前需要查询输入向量为\(x=(1,x_1,\cdots,x_n)\)时的预测输出,则构建一个线性回归模型:\(h_\theta=\theta^Tx\),误差函数:
\[J(\theta)=\sum_{i=1}^mw^{(i)}(y^{(i)}-\theta^Tx^{(i)})^2
\]
其中,
\[w^{(i)}=\exp(-\frac{\|x^{(i)}-x\|^2}{2\tau^2})
\]

代码
locally_reg.m
data=load("quasar_train.csv");

X=(data(1,:))';
y=data(2,:);
plot(lambda,y,'-');
hold on;

tau=5;
theta=zeros(2,1);
m=length(X);
X=[ones(m,1),X];

for now=1:m
    x=X(now,:);
    w=zeros(m,1);
    for i=1:m
        w(i)=exp(-((X(i,:)-x)*((X(i,:)-x)')/(2*tau^2)));
    end

    for it=1:10
        nabla=zeros(2,1);
        H=zeros(2,2);
        for t=1:m
            for i=1:2
                nabla(i)=nabla(i)+2*w(t)*(y(t)-X(t,:)*theta)*(-X(t,i));
            end
        end
        for t=1:m
            for i=1:2
                for j=1:2
                    H(i,j)=H(i,j)+2*w(t)*X(t,i)*X(t,j);
                end
            end
        end
        theta=theta-inv(H)*nabla;
    end

    %Plot the line
    plotx=[x(2)-0.5,x(2)+0.5];
    ploty=(theta(1)+theta(2).*plotx);
    plot(plotx,ploty,'r-');
    hold on;
    %pause;
end
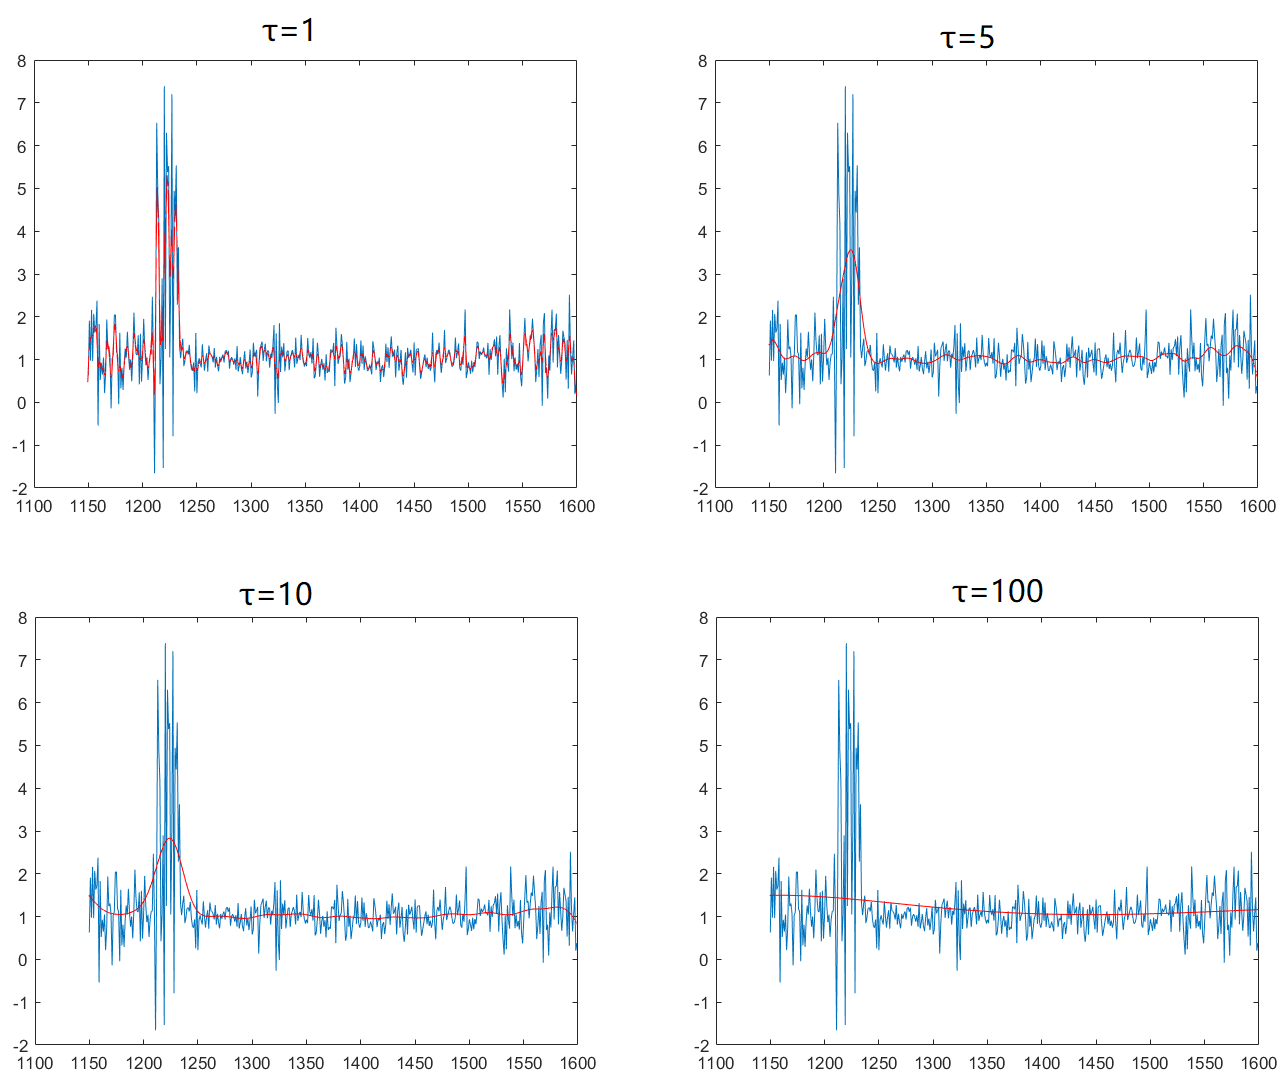
程序运行结果


