
Nload\Iftop(CentOS网速的实时监控)
Nload(CentOS网速的实时监控)的安装和安装过程中的问题
I. 安装
- Download the latest rpmforge-release rpm from
wget ftp://ftp.pbone.net/mirror/apt.sw.be/redhat/el6/en/x86_64/rpmforge/RPMS/rpmforge-release-0.5.3-1.el6.rf.x86_64.rpm
- Install rpmforge-release rpm:
rpm -Uvh rpmforge-release-0.5.3-1.el6.rf.x86_64.rpm
- Install nload rpm package:
yum install -y nload
II. 使用
查看帮助
nload -h
Options:
-a period       Sets the length in seconds of the time window for average
                calculation.
                平均计算时间长度
                Default is 300.
-i max_scaling  Specifies the 100% mark in kBit/s of the graph indicating the
                incoming bandwidth usage. Ignored if max_scaling is 0 or the
                switch -m is given.
                指定入口流量最大值 单位是kBit/s
                Default is 10240.
-m              Show multiple devices at a time; no traffic graphs.
                同时显示多个设备统计信息
-o max_scaling  Same as -i but for the graph indicating the outgoing bandwidth
                usage.
                和-i相同,但是是出口流量
                Default is 10240.
-t interval     Determines the refresh interval of the display in milliseconds.
                刷新间隔
                Default is 500.
-u h|b|k|m|g    Sets the type of unit used for the display of traffic numbers.
   H|B|K|M|G    h: auto, b: Bit/s, k: kBit/s, m: MBit/s etc.
                H: auto, B: Byte/s, K: kByte/s, M: MByte/s etc.
                显示单位
                Default is h.
-U h|b|k|m|g    Same as -u, but for a total amount of data (without "/s").
   H|B|K|M|G    Default is H.
                和-u相同,但是为总流量
devices         Network devices to use.
                指定网卡
                Default is to use all auto-detected devices.
--help
-h              Print this help.

example: nload -t 200 -i 1024 -o 128 -U M

The options above can also be changed at run time by pressing the 'F2' key.
运行时使用F2可以查看此页
图形查看
nload -t 200 -i 1024 -o 128 -U M
# 左右键可以在多个网卡之间切换
网卡流量
nload eth0
nload -m
安装Iftop到CentOS(YUM)
安装过程
1、安装iftop
yum -y install iftop
iftop可测量通过每一个套接字连接传输的数据;它采用的工作方式有别于nload。iftop使用pcap库来捕获进出网络适配器的数据包,然后汇总数据包大小和数量,搞清楚总的带宽使用情况。
虽然iftop报告每个连接所使用的带宽,但它无法报告参与某个套按字连接的进程名称/编号(ID)。不过由于基于pcap库,iftop能够过滤流量,并报告由过滤器指定的所选定主机连接的带宽使用情况。
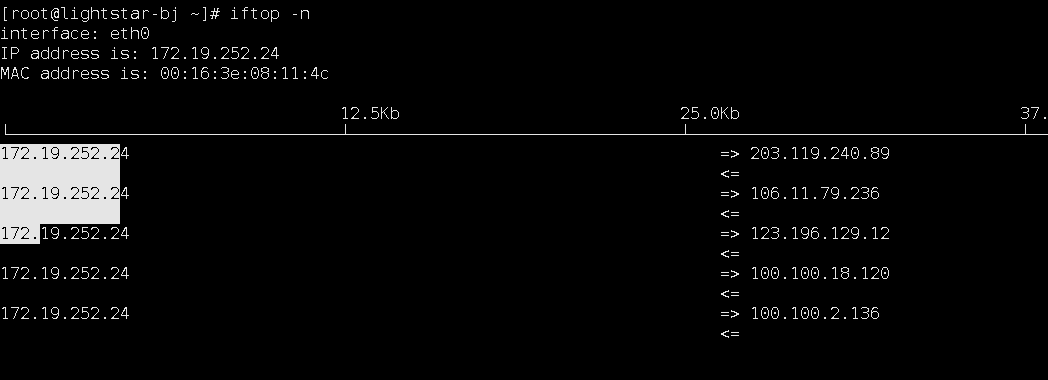
-n选项可以防止iftop将IP地址解析成主机名,解析本身就会带来额外的网络流量。
iftop -n
监控网卡流量
iftop -B -i eth0
# 语法:iftop [选项]
# 选项:
#  -h    显示帮助信息。
#  -B    以字节byte为单位显示带宽,默认是以Bit为单位。
#  -i    指定要监视的网络接口
#  -P    显示流量对应的端口
#字段说明:
#  TX     发送流量
#  RX     接收流量
#  TOTAL  总流量
#  Cumm   运行iftop到目前时间的总流量
#  peak   流量峰值
#  rates  分别表示过去 2s 10s 40s 的平均流量

 浙公网安备 33010602011771号