习题7.3
1.代码实现
点击查看代码
import numpy as np
from scipy.interpolate import interp1d, CubicSpline
import matplotlib.pyplot as plt
# 给定数据
T = np.array([700, 720, 740, 760, 780])
V = np.array([0.0997, 0.1218, 0.1406, 0.1551, 0.1664])
# 要插值的温度点
T_interp = np.array([750, 770])
# 线性插值
linear_interp = interp1d(T, V, kind='linear')
V_linear = linear_interp(T_interp)
# 三次样条插值
cubic_interp = CubicSpline(T, V)
V_cubic = cubic_interp(T_interp)
# 绘制插值函数和数据点
T_plot = np.linspace(700, 780, 100)
V_linear_plot = linear_interp(T_plot)
V_cubic_plot = cubic_interp(T_plot)
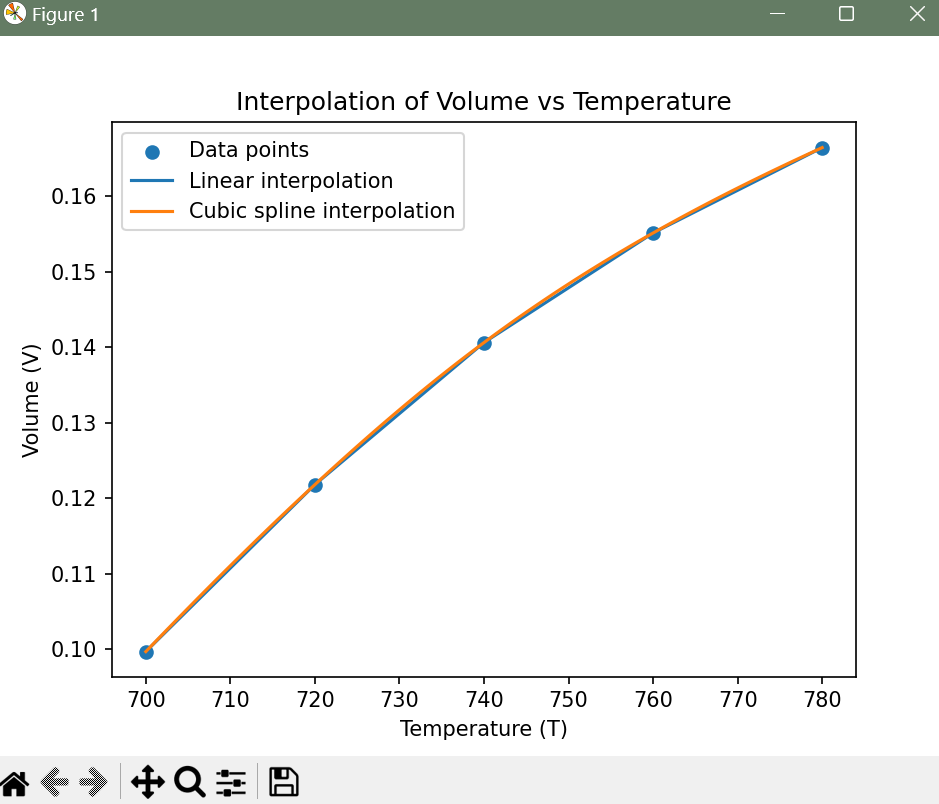
plt.scatter(T, V, label='Data points')
plt.plot(T_plot, V_linear_plot, label='Linear interpolation')
plt.plot(T_plot, V_cubic_plot, label='Cubic spline interpolation')
plt.xlabel('Temperature (T)')
plt.ylabel('Volume (V)')
plt.title('Interpolation of Volume vs Temperature')
plt.legend()
plt.show()
print("线性插值结果:", V_linear)
print("三次样条插值结果:", V_cubic)
print("3014")
2.运行结果


