习题2.2
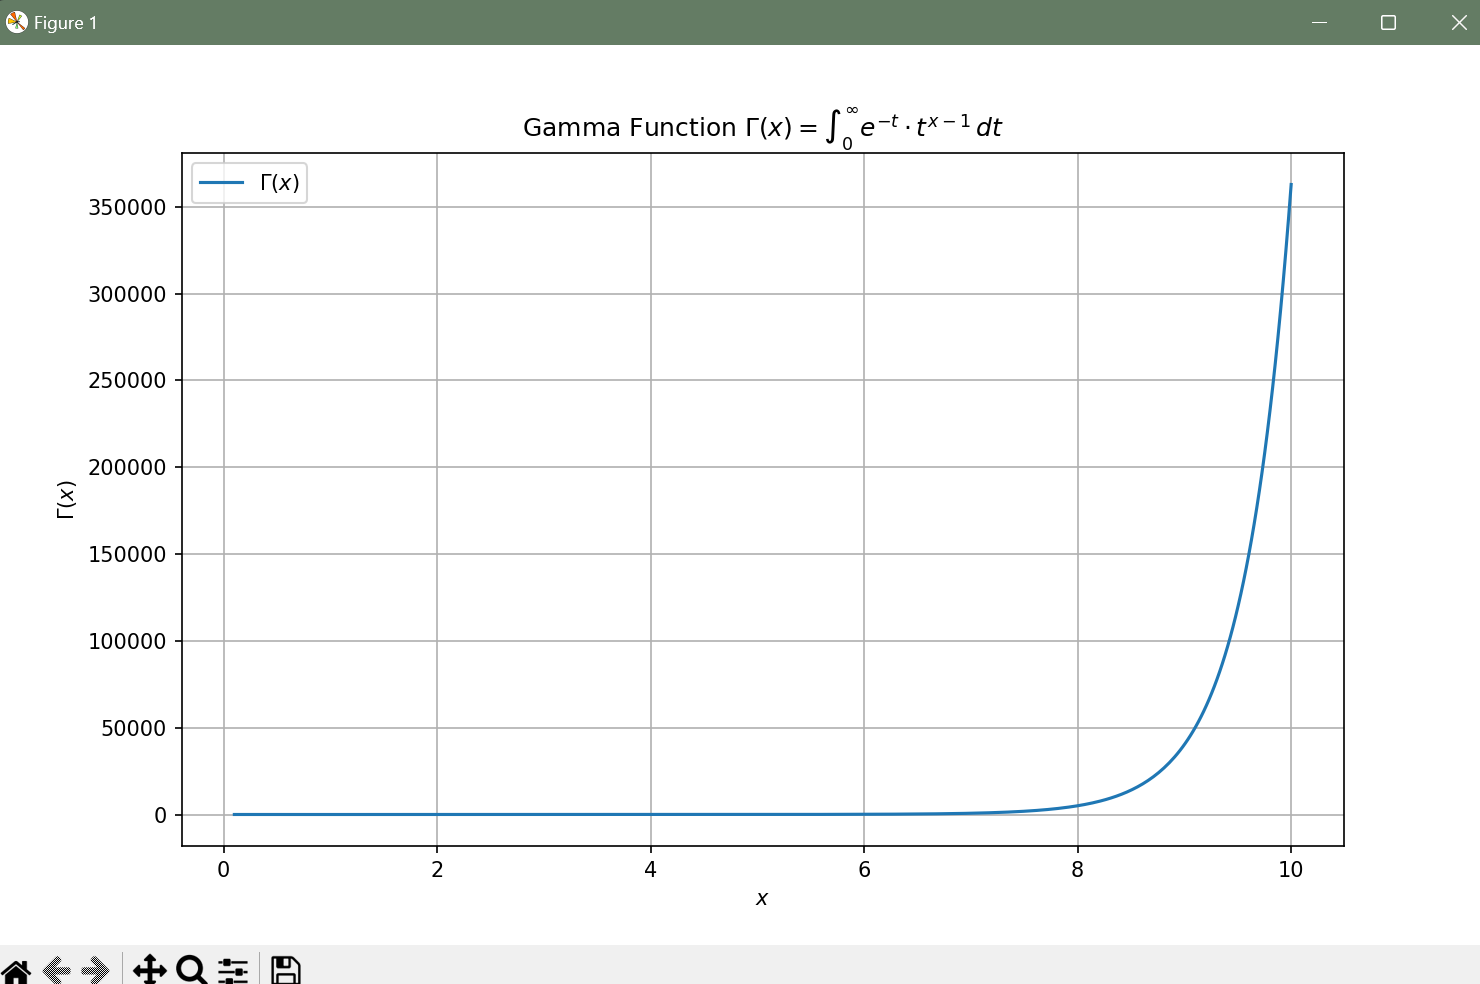
1.代码实现
点击查看代码
import numpy as np
import matplotlib.pyplot as plt
from scipy.special import gamma

# 定义x的范围
x = np.linspace(0.1, 10, 400)  # 注意从0.1开始,因为Gamma(0)是未定义的

# 计算Gamma函数的值
y = gamma(x)

# 绘制图像
plt.figure(figsize=(10, 6))
plt.plot(x, y, label=r'$\Gamma(x)$')

# 设置标签和标题
plt.xlabel(r'$x$')
plt.ylabel(r'$\Gamma(x)$')
plt.title(r'Gamma Function $\Gamma(x) = \int_{0}^{\infty} e^{-t} \cdot t^{x-1} \, dt$')
plt.grid(True)
plt.legend()

# 显示图像
plt.show()
2.运行结果


 浙公网安备 33010602011771号