习题2.1
1.代码实现
点击查看代码
import matplotlib as plt
from cProfile import label
import matplotlib.pyplot as plt
import numpy as np
from matplotlib import font_manager


my_font = font_manager.FontProperties(fname=
                                      "C:/Windows/Fonts/msyh.ttc")#微软雅黑字体的意思
plt.figure(figsize=(6, 5))  # 显示画布设置
plt.subplot(111)  # 第一个参数表示:行,第二个参数表示;列,第三个参数;当前图例中的激活位置
plt.xlabel(u'X数值', fontproperties=my_font)  # x标签设置
plt.ylabel(u'Y数值', fontproperties=my_font)  # y标签设置
plt.title(u"函数图像", fontproperties=my_font, fontsize=16)  # 图像名称设置
x1 = np.linspace(-10, 10, 100)  # -10,10均分100份
e = 2.718281828459
# 绘制chx双曲余弦
y1 = ((e ** x1) + (e ** -x1)) / 2
plt.plot(x1, y1, label=u'chx')
# 绘制双曲正弦shx
y2 = ((e ** x1) - (e ** -x1)) / 2
plt.plot(x1, y2, label=u'shx')
# 绘制,1/2e^x
y3 = 1 / 2 * (e ** x1)
plt.plot(x1, y3, label=u'1/2e^x')
plt.legend(prop=my_font)  # 显示函数文本标注。
plt.show()
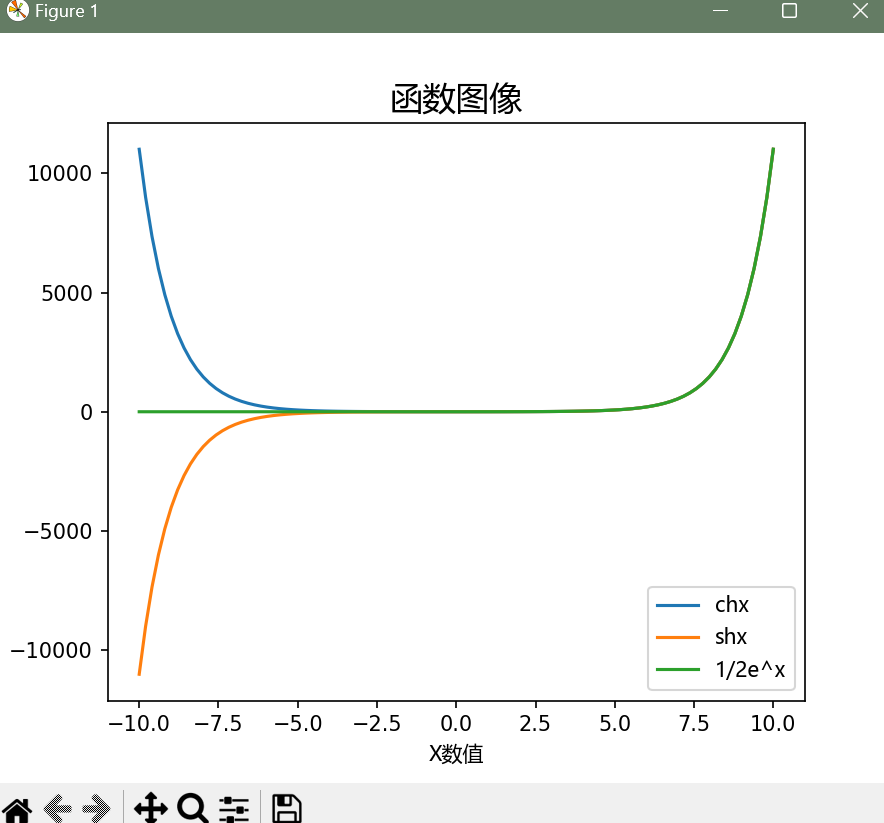
2.运行结果


