Prometheus+Grafana可视化监控【Elasticsearch状态】
Prometheus+Grafana部署请参考上篇文章: Prometheus+Grafana部署:
一、Prometheus监控Elasticsearch
1、安装elasticsearch_exporter
下载地址:https://github.com/prometheus-community/elasticsearch_exporter/releases
wget https://github.com/prometheus-community/elasticsearch_exporter/releases/download/v1.3.0/elasticsearch_exporter-1.3.0.linux-amd64.tar.gz
tar zxf elasticsearch_exporter-1.3.0.linux-amd64.tar.gz -C /usr/local/src/
2、启动
cd /usr/local/src/elasticsearch_exporter-1.3.0.linux-amd64/
nohup ./elasticsearch_exporter --es.all --es.indices --es.cluster_settings --es.indices_settings --es.shards --es.snapshots  --web.listen-address :9111 --es.uri http://10.9.11.12:9200 &
3、查看端口验证是否启动
netstat -anput |grep 9111
4、防火墙策略开放端口
firewall-cmd --add-port=9111/tcp --permanent
firewall-cmd --reload
5、prometheus服务器配置,编辑prometheus.yml文件
# 注意缩进,遵守yml格式
    - job_name: "Elasticsearch_10"
    static_configs:
      - targets: ["10.9.11.10:9111"]

  - job_name: "Elasticsearch_11"
    static_configs:
      - targets: ["10.9.11.11:9111"]

  - job_name: "Elasticsearch_12"
    static_configs:
      - targets: ["10.9.11.12:9111"]
systemctl restart prometheus.service
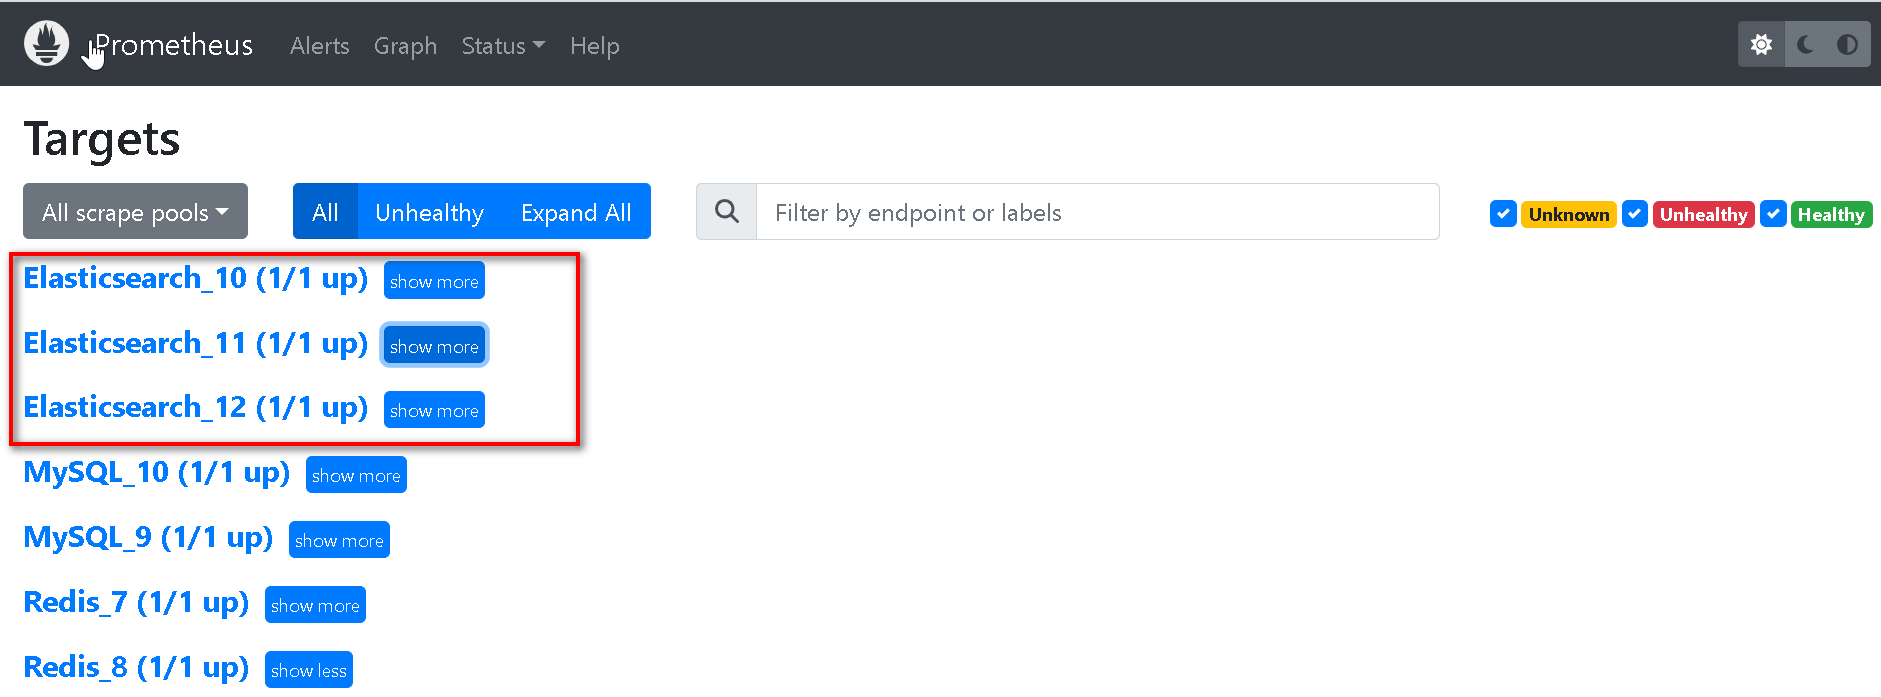
5、验证
prometheus页面验证
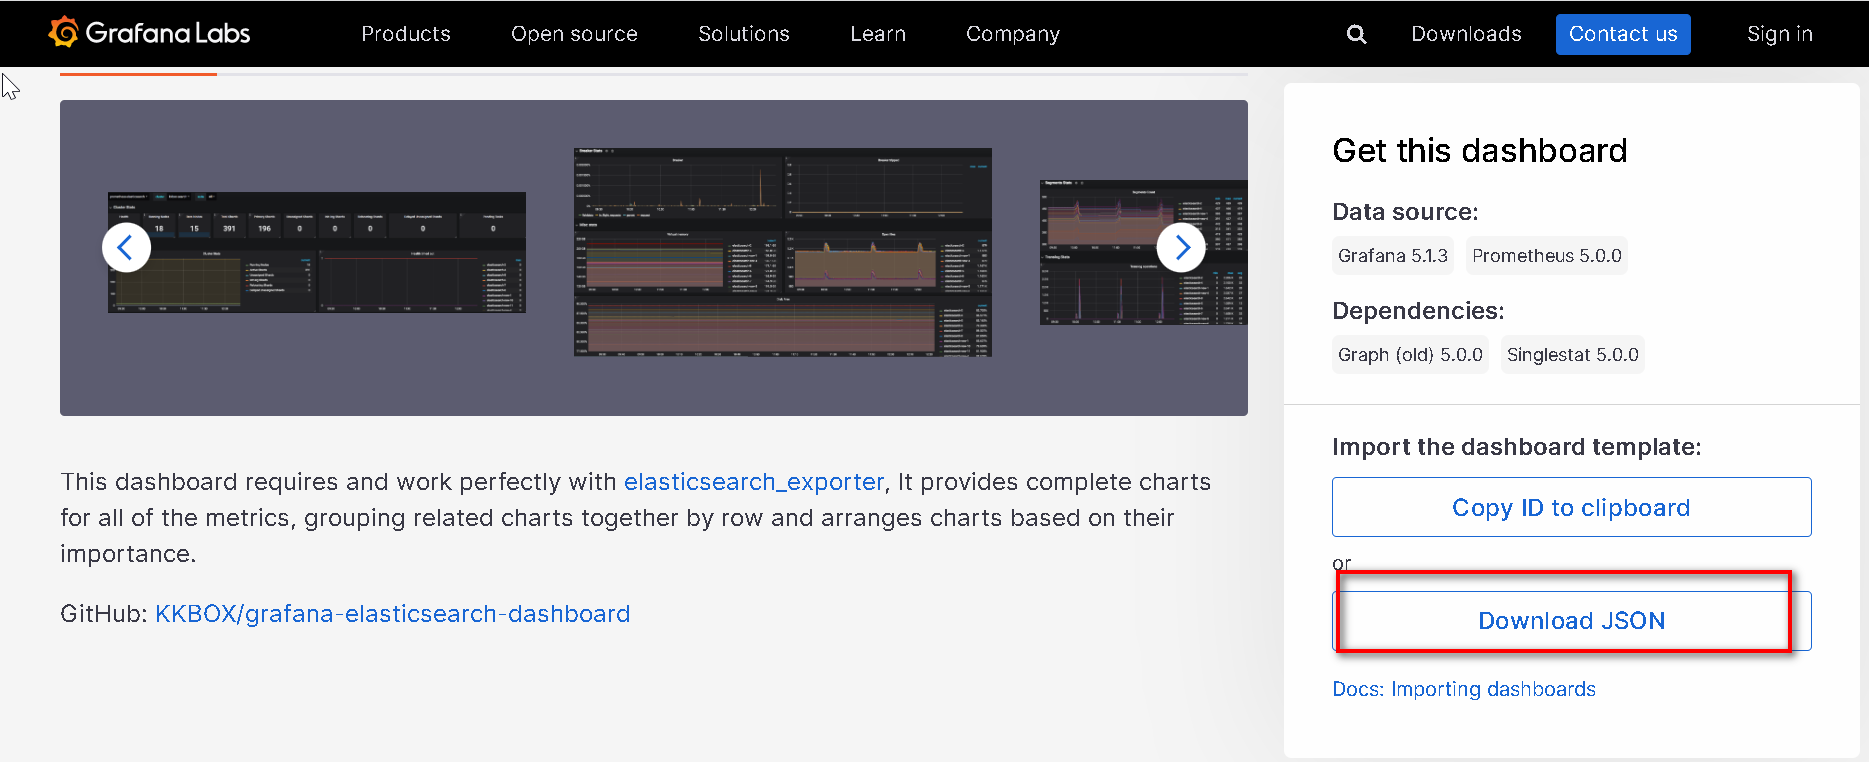
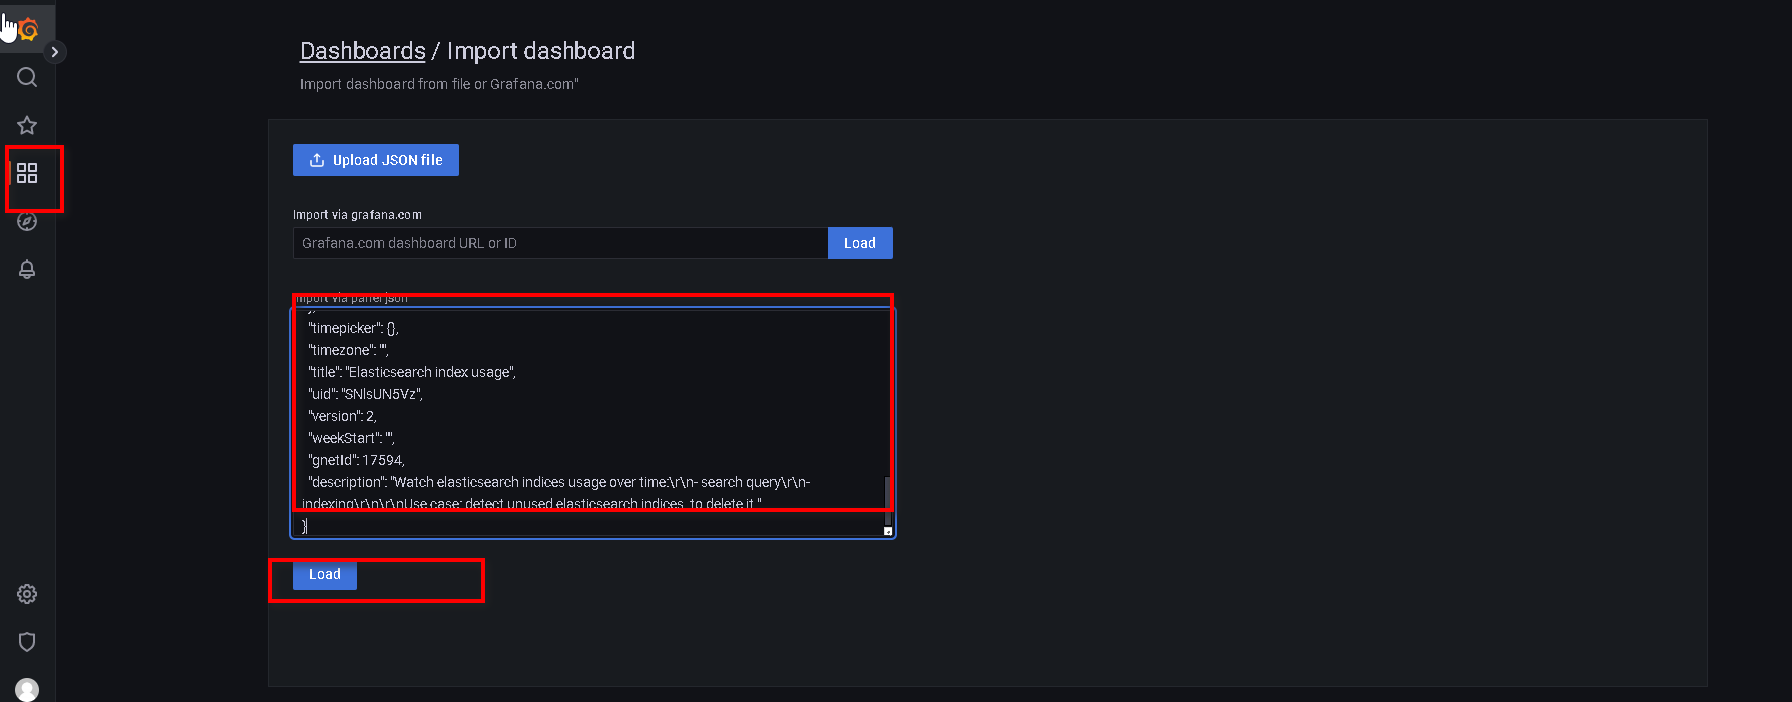
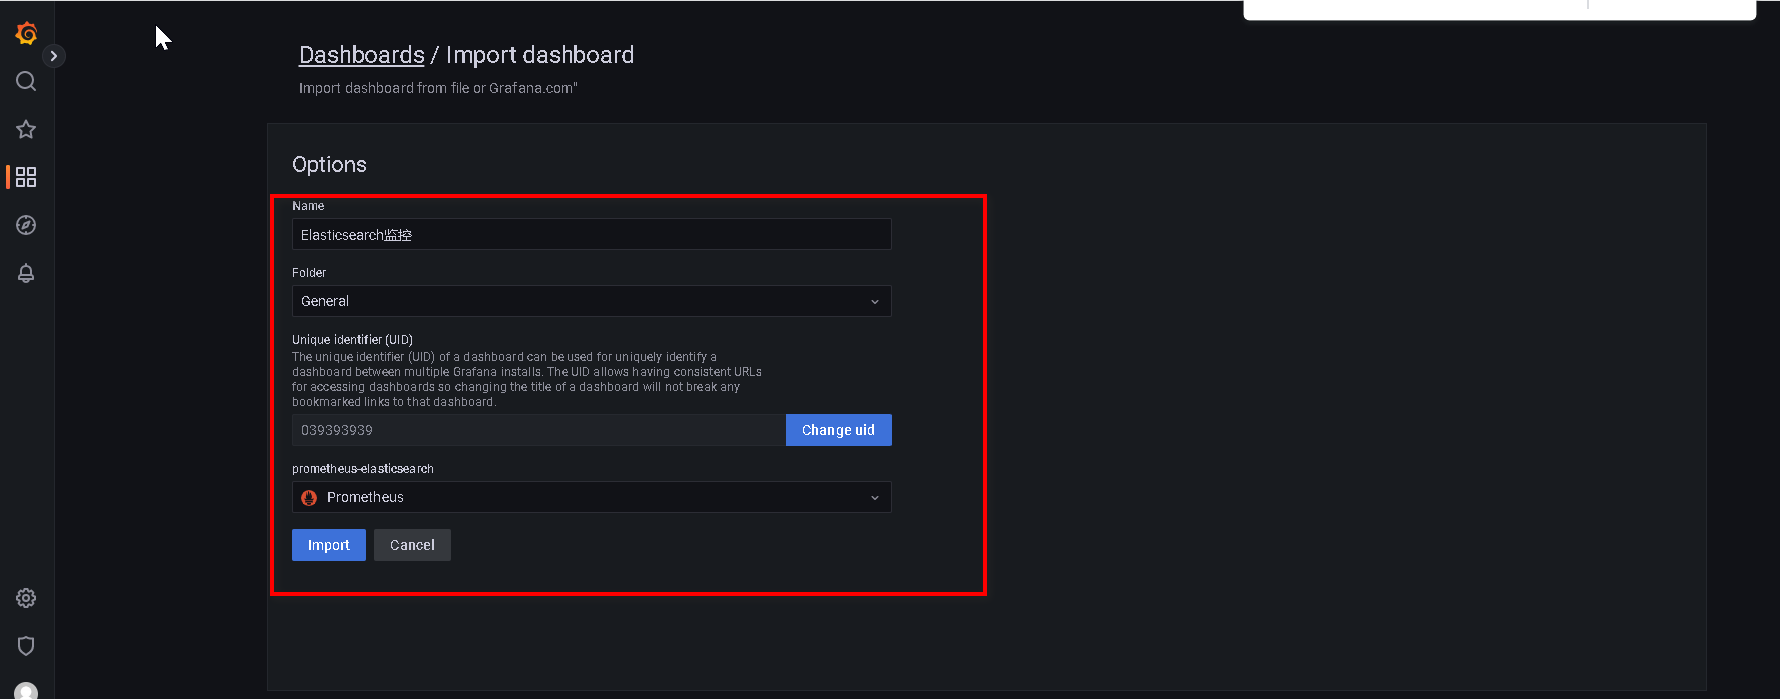
二、Grafana添加Elasticsearch监控模板
我这里内网环境,使用JSON格式进行导入
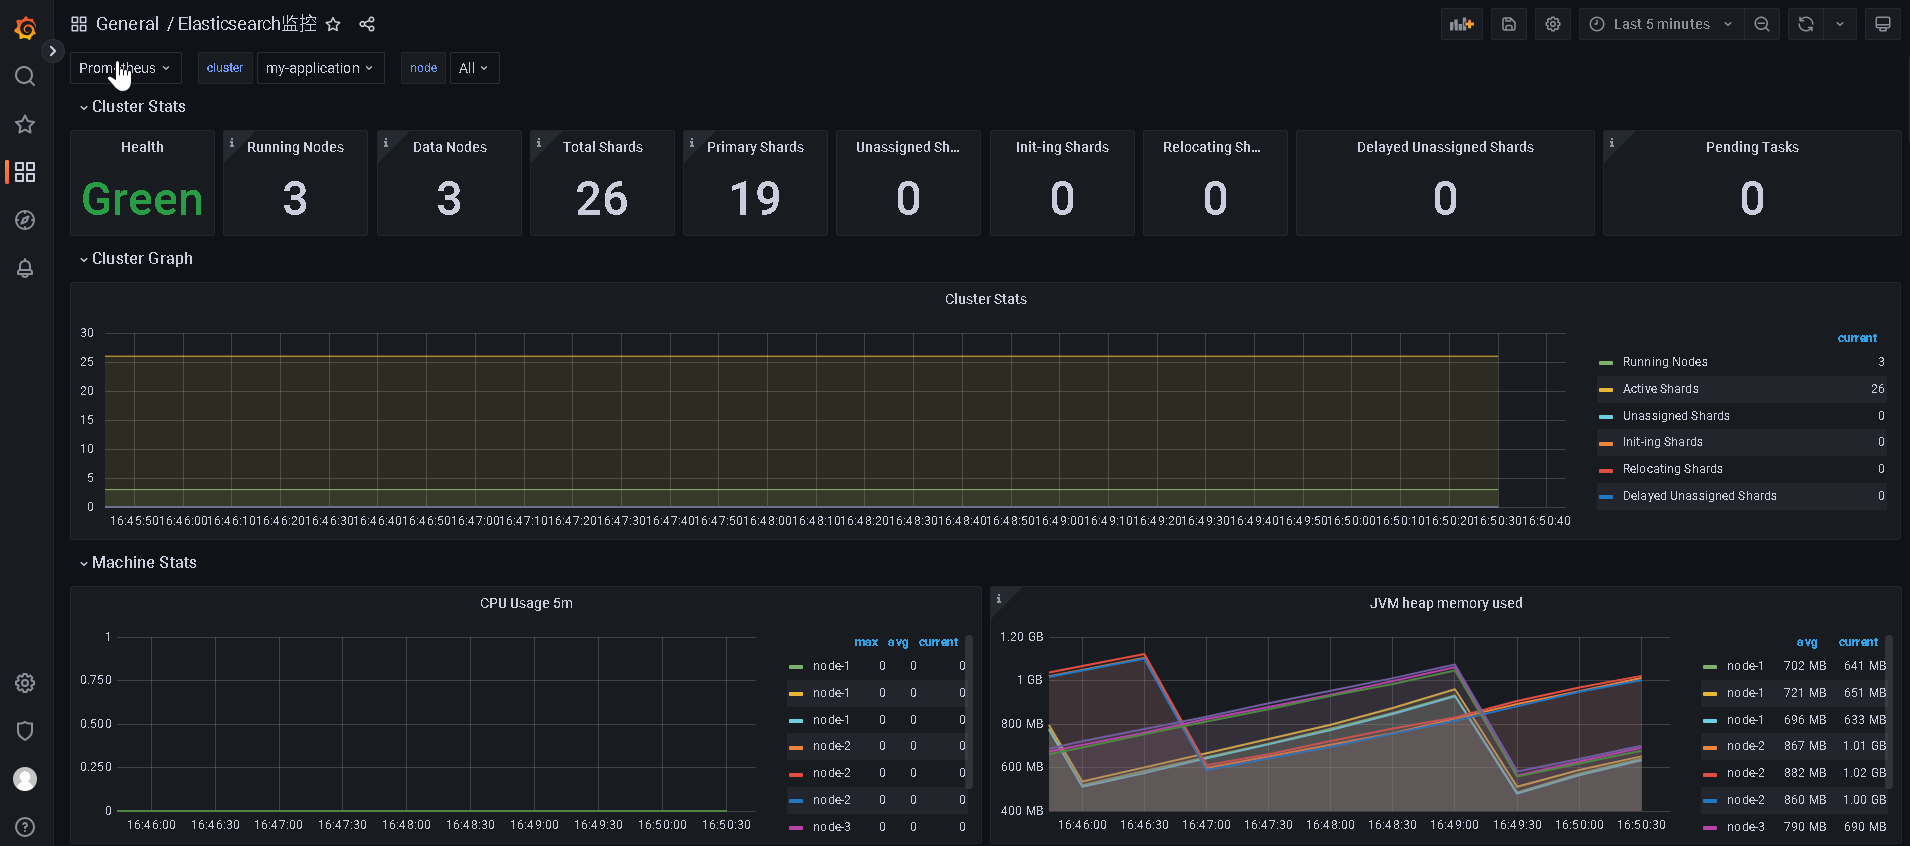
最终效果图如下: