ELK部署-实现Nginx日志收集
一、部署ES
1、创建网络下载镜像
docker network create elastic
docker pull elasticsearch:7.17.6
2、目录准备
mkdir /opt/ELK/elastic/{data,config} -p
chmod 777 /opt/ELK/elastic/data

cat >> /opt/ELK/elastic/config/elasticsearch.yml <<EOF
cluster.name: "ELK"
network.host: 0.0.0.0
xpack.security.enabled: true
xpack.security.transport.ssl.enabled: true
EOF
3、启动单节点es
docker run -itd --name elasticsearch --network elastic -p 9200:9200 -p 9300:9300 -v /opt/ELK/elastic/data:/usr/share/elasticsearch/data -v /opt/ELK/elastic/config/elasticsearch.yml:/usr/share/elasticsearch/config/elasticsearch.yml -e ES_JAVA_OPTS="-Xms512m -Xmx512m" -e "node.name=es1" -e "discovery.seed_hosts=es1" -e "cluster.initial_master_nodes=es1" -e "http.host=0.0.0.0" --privileged --restart=always elasticsearch:7.17.6
4、验证es正确性
http://IP:Port/_cat/health
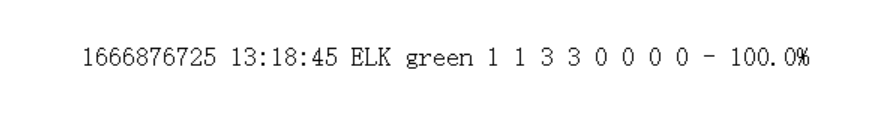
含义说明:
- 前两项表示启动时间
- 第三项表示集群名称
- 第四项表示集群健康状态
- 后面标识ES节点,分片等数量
ES健康状态
- green:集群所有数据处在正常状态
- yellow:集群所有数据都可以访问,但一些数据的副本还没有分配
- red:集群部分数据不可访问
二、部署Logstash
logstash需要部署到所有需要收集日志的服务器上面,所以说使用docker方式部署会有一定的局限性,所以这里采用tar包部署
1、部署安装
wget https://artifacts.elastic.co/downloads/logstash/logstash-7.17.0-linux-x86_64.tar.gz
tar zxf logstash-7.17.0-linux-x86_64.tar.gz
cd logstash-7.17.0/
2、测试可用性
./logstash -e 'input { stdin { } } output { stdout {} }'
我们输入的时候 会显示出来
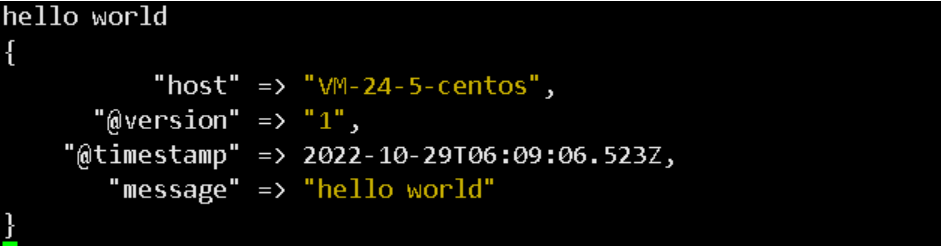
解释:
@timestamp:标记时间发生的时间
host:事件发生的主机
@version:标记事件唯一类型
3、编写logstash配置文件 收集Nginx日志信息
cd /root/logstash-7.17.0/config
cp logstash-sample.conf nginxlog.conf
收集Nginx日志到终端 测试是否可以正常输出内容
input {
    file {
        path => "/var/log/nginx/*.log"
        exclude => "error.log"
        start_position => "beginning"
        tags => ["web","nginx"]
        type => "access"
        add_field => {
	    "project" => "nginx-access-log"
             "app" => "nginx"
		}
	}
  }

filter {
}

output {
    stdout{
    }
}
如果可以正常输出Nginx日志到终端 表示配置没问题
接下来修改Nginx日志使用json格式
http {
....
log_format main   '{"@timestamp":"$time_iso8601",'
                    '"@source":"$server_addr",'
                    '"hostname":"$hostname",'
                    '"remote_user":"$remote_user",'
                    '"ip":"$http_x_forwarded_for",'
                    '"client":"$remote_addr",'
                    '"request_method":"$request_method",'
                    '"scheme":"$scheme",'
                    '"domain":"$server_name",'
                    '"referer":"$http_referer",'
                    '"request":"$request_uri",'
                    '"requesturl":"$request",'
                    '"args":"$args",'
                    '"size":$body_bytes_sent,'
                    '"status": $status,'
                    '"responsetime":$request_time,'
                    '"upstreamtime":"$upstream_response_time",'
                    '"upstreamaddr":"$upstream_addr",'
                    '"http_user_agent":"$http_user_agent",'
                    '"http_cookie":"$http_cookie",'
                    '"https":"$https"'
                    '}';
添加通过 message 字段过滤
cat nginxlog.conf
input {
    file {
        path => "/var/log/nginx/*.log"
        exclude => "error.log"
        start_position => "beginning"
        tags => ["web","nginx"]
        type => "access"
        add_field => {
	    "project" => "nginx-access-log"
             "app" => "nginx"
		}
	}
  }

filter {
    json {
    source => "message"
    skip_on_invalid_json => "true"
  }
}

output {
    stdout{
    }
}
4、将Nginx日志输出到ES中
input {
    file {
        path => "/var/log/nginx/*.log"
        exclude => "error.log"
        start_position => "beginning"
        tags => ["web","nginx"]
        type => "access"
        add_field => {
	    "project" => "nginx-access-log"
             "app" => "nginx"
		}
	}
  }

filter {
    json {
    source => "message"
    skip_on_invalid_json => "true"
  }
}

output {
    elasticsearch {
	hosts => ["10.0.24.5"]
	index => "nginx-access-log-%{+YYYY.MM.dd}"

	}
}
三、Kibana部署
1、部署
docker run -itd --name kibana --network elastic -p 5601:5601 -e "I18N_LOCALE=zh-CN" -e "ELASTICSEARCH_HOST=http://elasticsearch:9200" kibana:7.17.6
浏览器访问:http://IP:5601
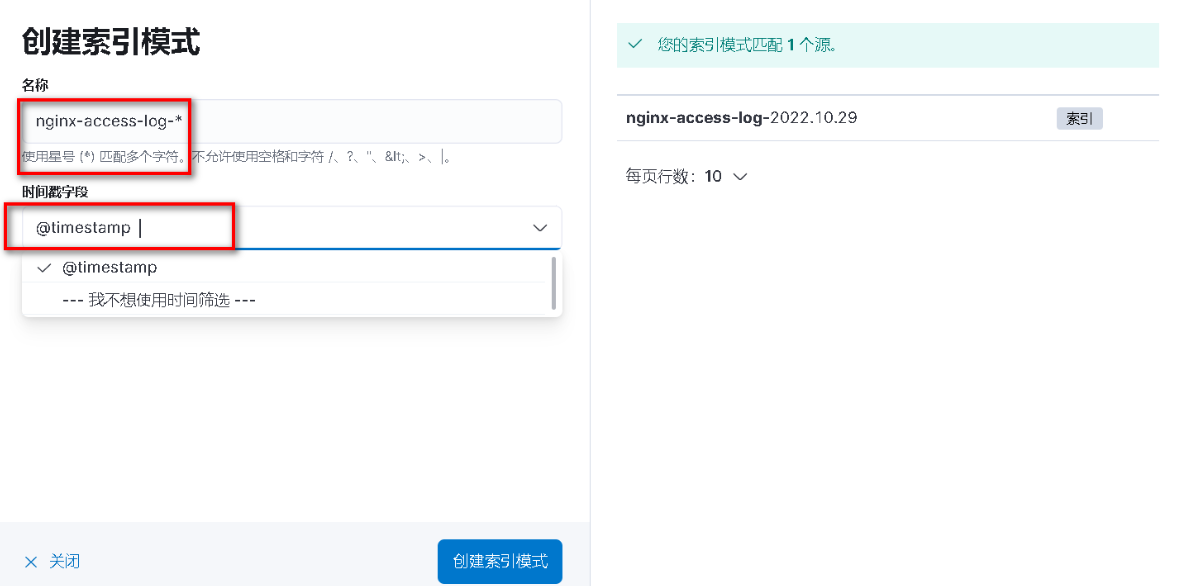
2、创建Nginx索引
Discover > 创建
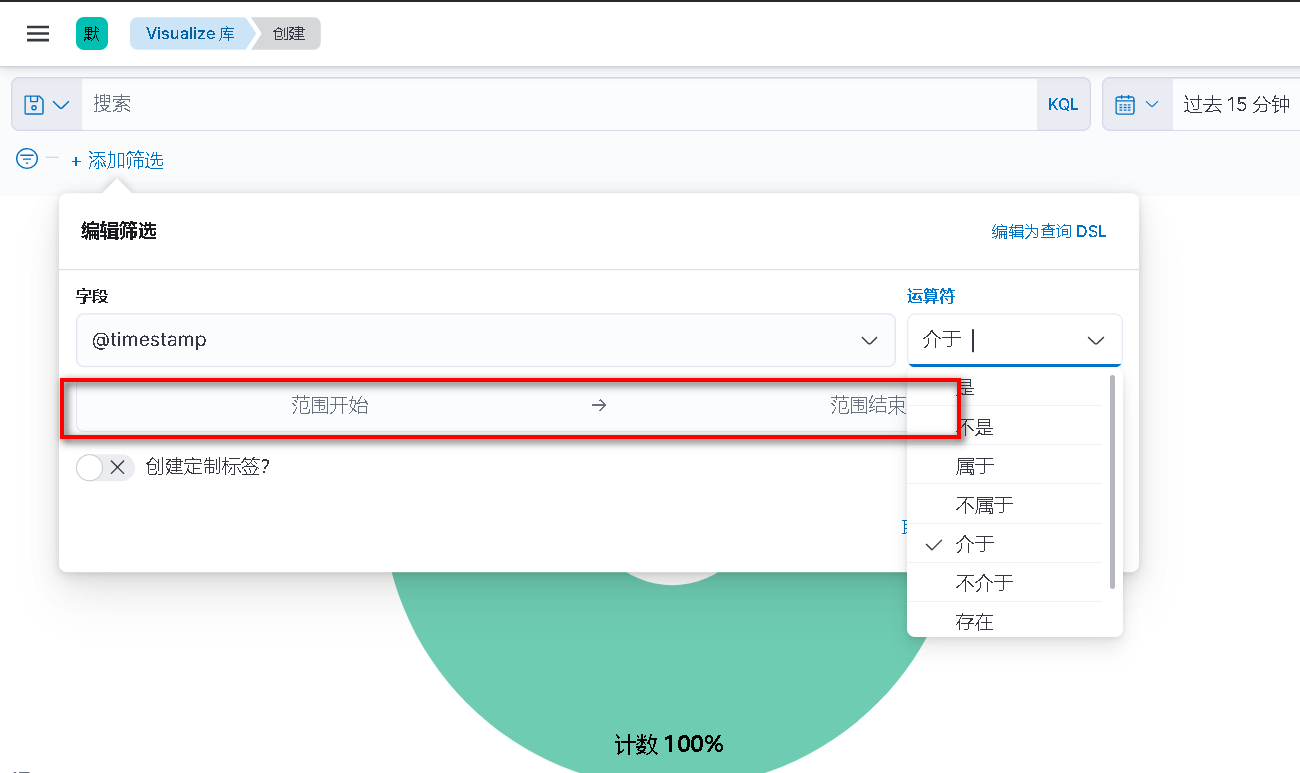
3、创建可视化
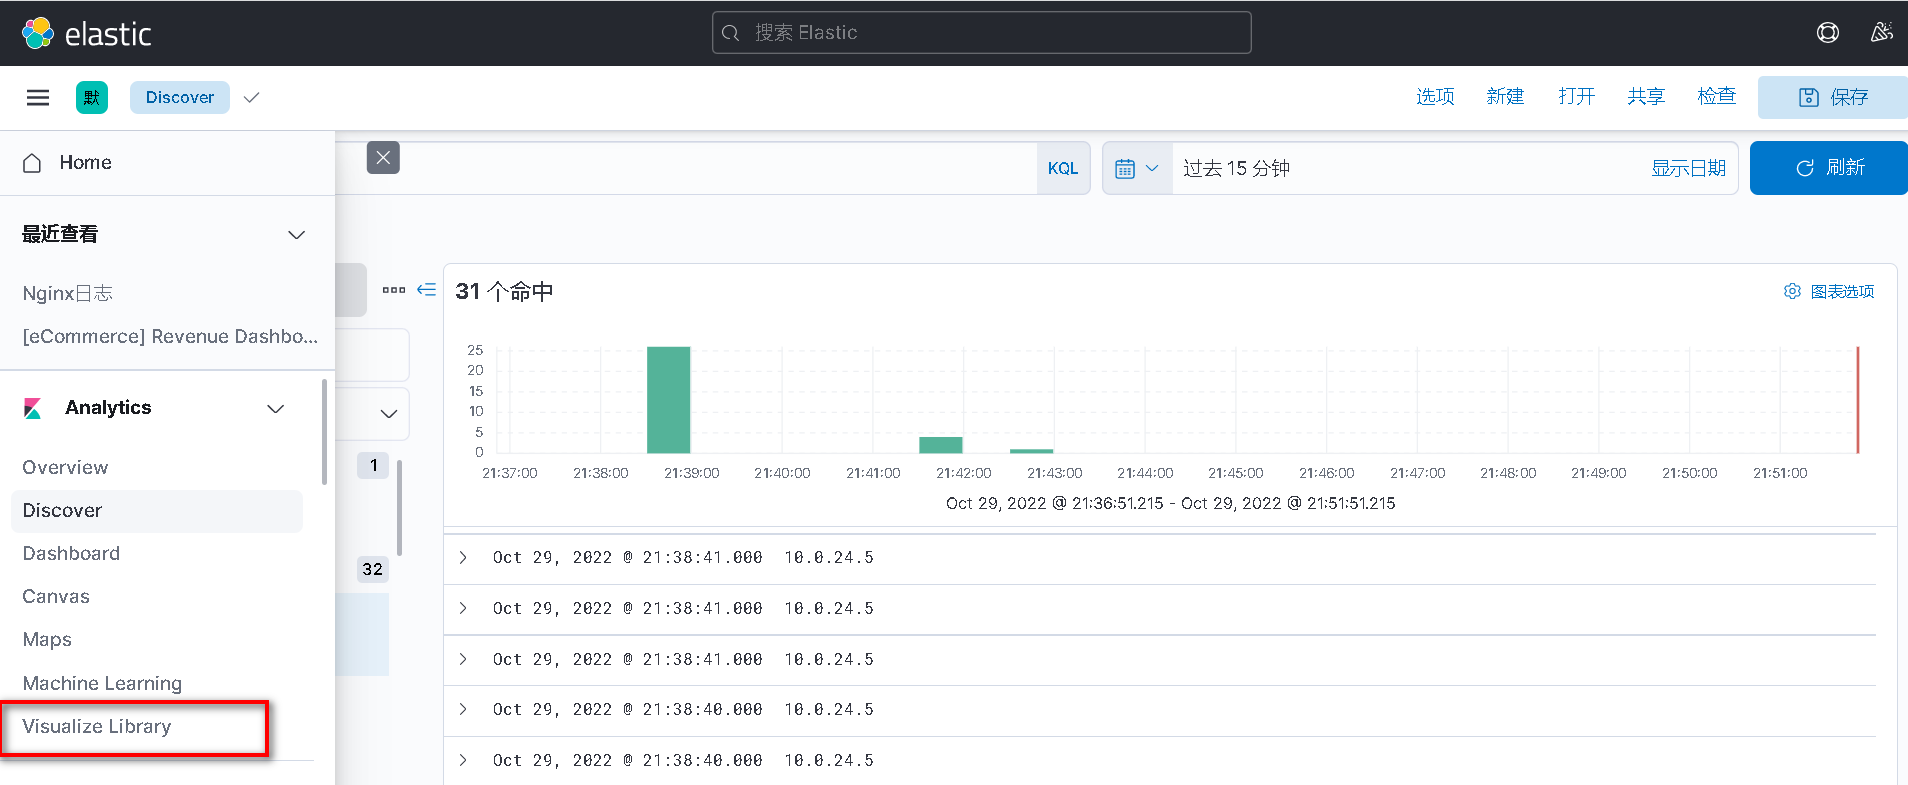
根据需求选择创建 饼状体、数据图等
根据索引筛选过滤信息 如:Nginx xxx -xxxx 时间段访问记录

 浙公网安备 33010602011771号