Matlab for循环画图加legend
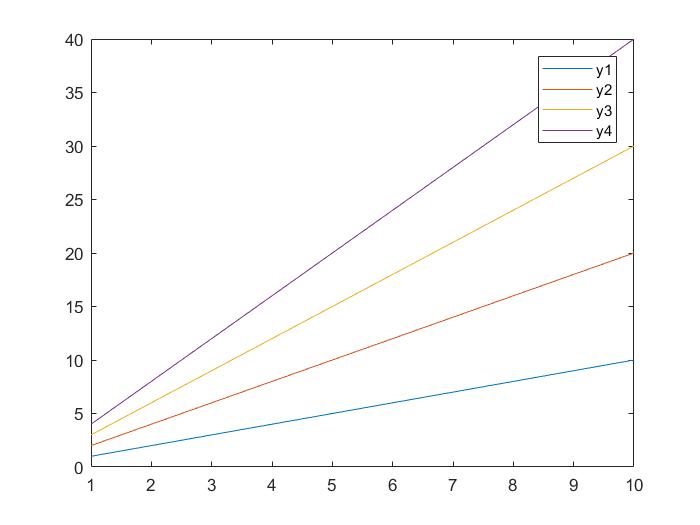
x = 1:10;
h = zeros(4);
for i = 1:4
    y = i*x;
    h(i) = plot(x,y);
    hold on
end
legend(h([1,2,3,4]),'y1','y2','y3','y4')
hold off
在 for 循环中根据循环改变 legend,效果图如下
x = 1:10; h = zeros(4); for i = 1:4 y = i*x; h(i) = plot(x,y); hold on end legend(h([1,2,3,4]),'y1','y2','y3','y4') hold off
在 for 循环中根据循环改变 legend,效果图如下

 浙公网安备 33010602011771号