echarts折线图 x 轴 y 轴不展示 背景图为网格 鼠标划上样式修改等
:header-cell-style="{backgroundColor:'#F6F8F9', color: '#333',textAlign:'center'}"
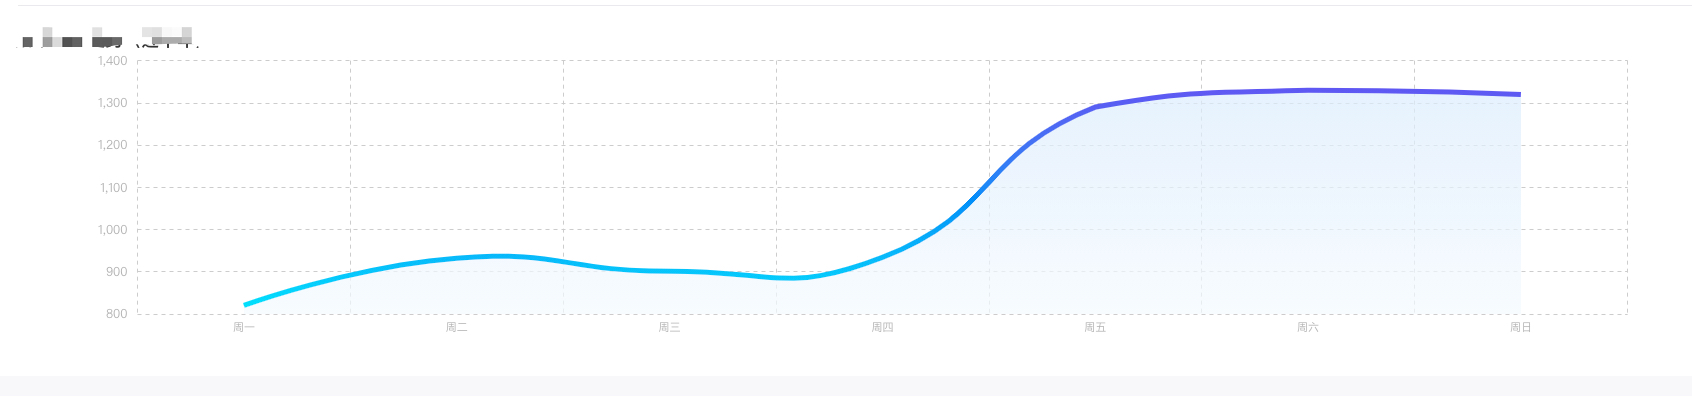
要求1、折线为渐变色
2、折线区域渐变色
3、x 轴 y轴不展示
4、折线图背景为网格
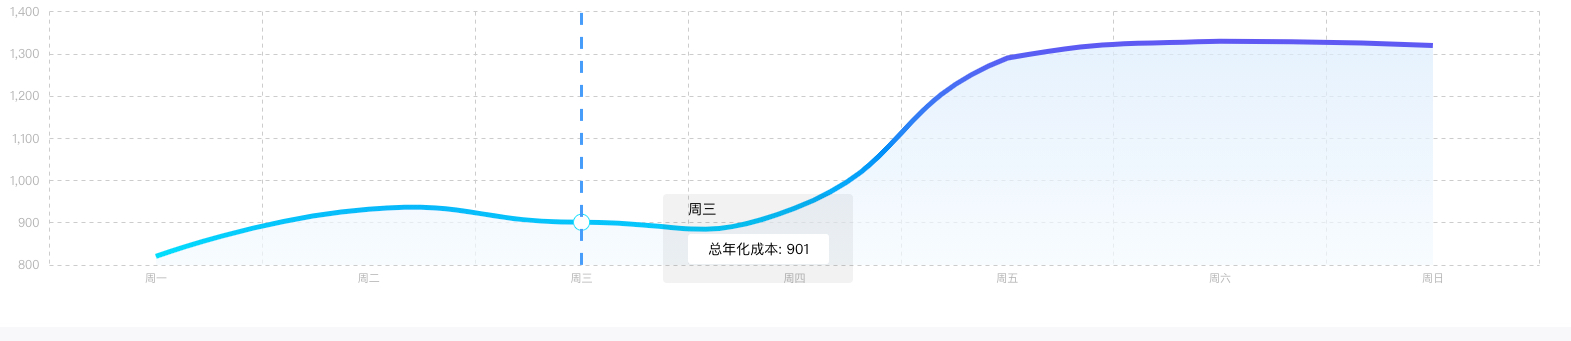
5、鼠标划上样式修改
 const option = {
                    title: {
                        text: '折线图'
                    },
                    xAxis: {
                        type: 'category',
                        // boundaryGap: false, true时用在柱状图比较合适 可以保证刻度线和标签对齐
                        data: ['周一', '周二', '周三', '周四', '周五', '周六', '周日'],
                        axisTick: {show: false},//不展示坐标轴刻度
                        splitLine: {
                            show: true,       //展示背景图
                            lineStyle: {
                                type: 'dashed',
                                color: '#ccc'
                            }
                        },
                        axisLabel: {
                            // 设置x轴文字颜色、字体大小、字体风格
                            color: '#b3b3b3',
                            fontSize: 11,
                            fontFamily: 'SourceHanSansCN-Light'
                        },
                        axisLine: {
                            show: false
                        }
                    },
                    grid: {
                        // 设置表格偏移量
                        top: '10.5%',
                        left: '5%',
                        right: '8%',
                        bottom: '7%',
                        containLabel: true
                    },
                    yAxis: {
                        position: 'left',
                        scale: true,
                        splitLine: {
                            show: true,
                            lineStyle: {
                                type: 'dashed',
                                color: '#ccc',
                                cap: 'butt'

                            }
                        },
                        axisTick: {
                            show: false
                        },
                        type: 'value',
                        axisLine: {
                            show: false,
                            lineStyle: {
                                color: '#b3b3b3'
                            }
                        },
                        axisLabel: {
                            margin: 10,
                            textStyle: {
                                fontSize: 12
                            }
                        }
                    },
                    series: [
                        {
                            data: [820, 932, 901, 934, 1290, 1330, 1320],
                            type: 'line',
                            symbol: 'emptyCircle',
                            symbolSize: 10,
                            sampling: 'lttb',
                            smooth: true,
                            // 隐藏折点
                            showSymbol: false,
                            // 改变线条的颜色和粗细
                            lineStyle: {
                                width: 5
                            },
                            areaStyle: {
                                color: {
                                    type: 'linear',
                                    x: 0,
                                    y: 0,
                                    x2: 0,
                                    y2: 1,
                                    colorStops: [ // 渐变颜色
                                        {
                                            offset: 0,
                                            color: '#DFECFE'
                                        },
                                        {
                                            offset: 1,
                                            color: '#F5FAFE'
                                        }
                                    ],
                                    global: false
                                }
                            }
                        }
                    ],
                    tooltip: {
                        trigger: 'axis',
                        showDelay: 0,
                        backgroundColor: 'rgba(0,0,0,0.05)',
                        // formatter: '{b}<br/>总年化成本 : {c}', 普通展示样式
                        padding: [5, 25],
                        axisPointer: {
                            type: 'line',
                            lineStyle: {
                                color: '#6499FF',
                                width: 3,
                                type: 'dashed'
                            }
                        },
                        textStyle: {
                            color: 'black',
                            align: 'left',
                            fontSize: 14
                        },
                        position: 'left',
                        formatter: (v) => {
                            const value1 = v[0].name;
                            const value2 = v[0].value;
                            return `<div>
                              <span>${value1}</span><br />
                              <p style=\"display:inline-block;;border-radius:3px;width:100%;
                              height:30px;background-color:white;line-height:30px;padding:0 20px;\">总年化成本: ${value2}</p><br />
                              </div>`;
                        }
                    },
                    itemStyle: {
                        color: new this.$echarts.graphic.LinearGradient(0, 0, 0, 1, [
                            {offset: 0, color: '#6850F8'},
                            {offset: 0.5, color: '#4989FD'},
                            {offset: 1, color: '#66DEFF'}

                        ])
                    }
                };