八、Pandas 表格处理
pandas有两个数据结构,一个是series 另一个是DataFrame
from matplotlib import pyplot as plt
import numpy as np
import pandas as pd
from numpy import nan as NA
from pandas import DataFrame, Series

%matplotlib inline
series 本质上是一维数组
# Series
# 数组与字典的结合,有序,但是可以使用非数字下标索引。


可以直接通过索引访问

obj = Series([4, 7, -5, 3])
obj
0    4
1    7
2   -5
3    3
dtype: int64
obj2 = Series([4, 7, -5, 3], index=['d', 'b', 'a', 'c']) #可以指定数组下标
print(obj2)
print(obj2.index)
d    4
b    7
a   -5
c    3
dtype: int64
Index(['d', 'b', 'a', 'c'], dtype='object')
print(obj2[1])
print(obj2['c'])
7
3
obj = Series([4, 7, -5, 3])
obj
0    4
1    7
2   -5
3    3
dtype: int64
sdata = {'Ohio': 35000, 'Texas': 71000, 'Oregon': 16000, 'Utah': 5000}
obj3 = Series(sdata) # 使用字典初始化Series,但是顺序没有保证。
obj3
Ohio      35000
Oregon    16000
Texas     71000
Utah       5000
dtype: int64
obj3 + obj4 # 对应索引位置相加,对不上的设置为None

obj = Series([4, 7, -3, 2])
obj.sort_values() # 根据值排序
2   -3
3    2
0    4
1    7
dtype: int64
index = ['d', 'c', 'a', 'b']
obj = Series([4, 7, -3, 2], index=index)
index = sorted(index)
obj = obj.reindex(index)
obj
a   -3
b    2
c    7
d    4
dtype: int64
# DataFrame
# 本质上就是一个二维数组,用index定位行,用columns定位列。
# col_1 col_2 ... col_n
# index_1 x11 x12 x1n
# index_2 x21 x22 x2n
# ...
# index_m xm1 xm2 xmn
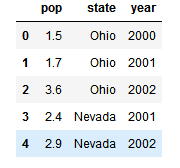
data = {'state': ['Ohio', 'Ohio', 'Ohio', 'Nevada', 'Nevada'],
'year': [2000, 2001, 2002, 2001, 2002],
'pop': [1.5, 1.7, 3.6, 2.4, 2.9]} # key代表列的名字,对应的数组就是这个列的值。
frame = DataFrame(data)
frame
注意:DataFrame中行和列形式,df[row, col]
print(frame - s) # 每一行减去对应的s,本质上每一行在对应的索引位置上相减。

frame = DataFrame(np.random.randn(4, 3),
columns=list('bde'),
index=['Utah', 'Ohio', 'Texas', 'Oregon'])
print(frame)
# np.abs(frame) # 元素级函数
               b         d         e
Utah    0.062497  0.288348 -0.808569
Ohio    0.349030  0.088106  0.930447
Texas  -0.422867 -0.349967 -1.472045
Oregon  0.664530 -0.415166  0.494318
# 排序
frame = DataFrame(np.arange(8).reshape((2, 4)),
index=['three', 'one'],
columns=['d', 'a', 'b', 'c'])
frame.sort_index() # 按行索引排序
frame.sort_index(axis=1, ascending=False) # 按列名降序排序
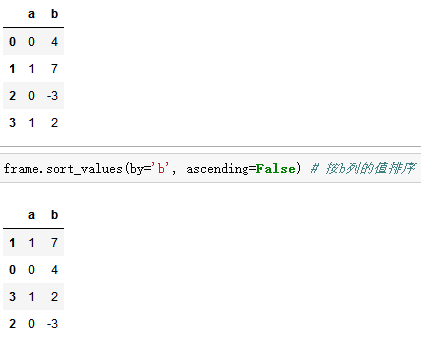
frame = DataFrame({'b': [4, 7, -3, 2], 'a': [0, 1, 0, 1]})
frame
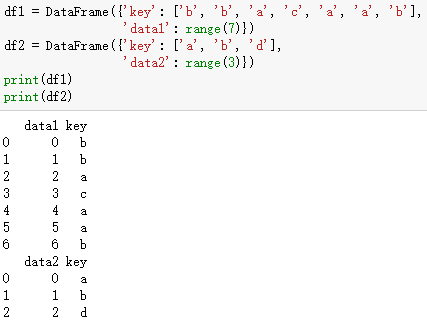
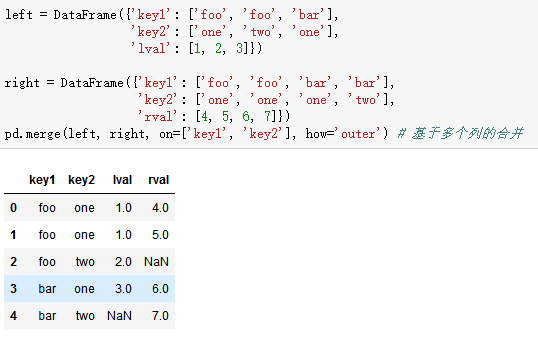
# 数据合并,首先复习一下SQL关于join的概念。
# outer: 左右,左-,-右
# inner:左右
# left: 左右,左-
# right: 左右,-右
# 其他需要的知识点
# 1. pivot和melt
# 2. 值替换
# 3. 数据切割
# 4. 排列组合和随机采样
