
线性回归
一、 概述
寻找一条线,最大程度的“拟合”样本与特征与样本输出标记之间的关系,推算出自变量与因变量关系,是一个预测问题。
有关误差可以参考:https://www.cnblogs.com/qianslup/p/16847591.html
标准化可以参考:https://www.cnblogs.com/qianslup/p/16847967.html
二、案例
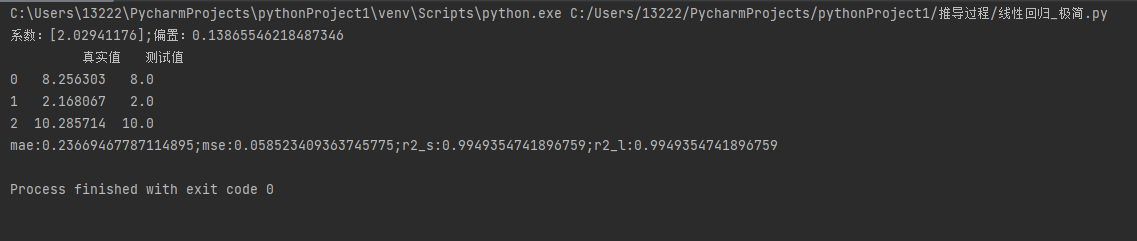
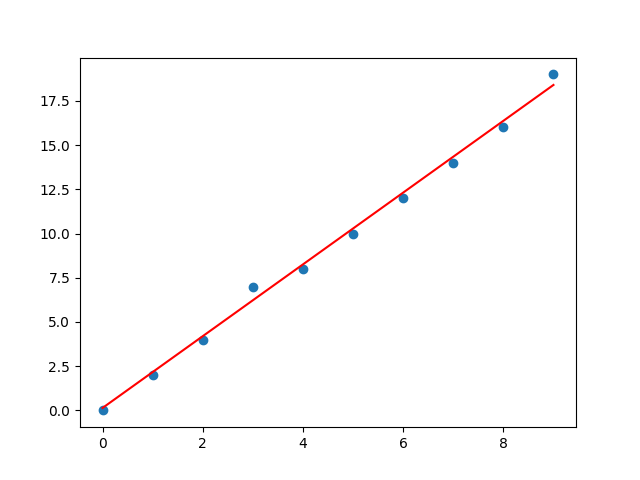
2.1 极简案例
一个简单的一元一次方程进行预测
import numpy as np
import pandas as pd
from sklearn.metrics import mean_squared_error
from sklearn.metrics import mean_absolute_error
from sklearn.metrics import r2_score
from sklearn.model_selection import train_test_split
from sklearn.linear_model import LinearRegression
import matplotlib.pyplot as plt


# 构造数据
x = np.arange(0, 10, 1)
y = 2*x + np.random.randint(low=0, high=2, size=10)
X = x.reshape(-1, 1)

# 拆分数据
X_train, X_test, y_train, y_test = train_test_split(X, y, test_size=0.25, random_state=2)
lr = LinearRegression()
lr.fit(X_train, y_train)
print(f'系数:{lr.coef_};偏置:{lr.intercept_}')

y2 = lr.coef_ * x+lr.intercept_   # 训练得出的结果

y_pre = lr.predict(X_test)
data = np.array([list(y_pre), list(y_test)]).transpose()
df = pd.DataFrame(data=data, columns=['真实值', '测试值'])
print(df)
# 误差分析
mae = mean_absolute_error(y_test, y_pre)  # 绝对值误差
mse = mean_squared_error(y_test, y_pre)   # 均方误差
r2_s = r2_score(y_test, y_pre)            # 拟合度
r2_l = lr.score(X_test, y_test)           # 拟合度的另一种求法
print(f'mae:{mae};mse:{mse};r2_s:{r2_s};r2_l:{r2_l}')

# 图表展示
plt.scatter(x, y)
plt.plot(x, lr.predict(X), color = 'r')
plt.show()
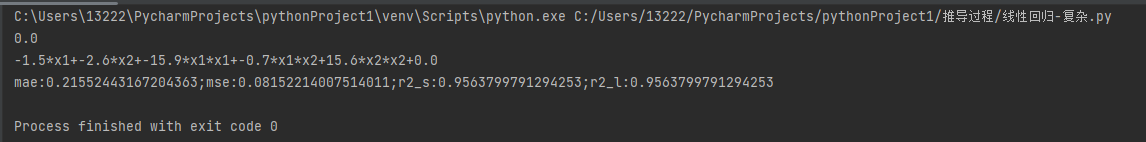
2.1 复杂案例
二元二次方程,更多元更多次的求解方式一样
import numpy as np
from sklearn.model_selection import train_test_split
from sklearn.linear_model import LinearRegression
from sklearn.preprocessing import PolynomialFeatures
from sklearn.preprocessing import StandardScaler
import matplotlib.pyplot as plt
from sklearn.metrics import mean_squared_error
from sklearn.metrics import mean_absolute_error
from sklearn.metrics import r2_score

x1 = np.arange(-10, 10, 1)
x2 = np.arange(-20, 20, 2)

y = 3*x1*x1 + 2*x1 + x2*x2 + 3*x2 + x1*x2+np.random.randint(low=-20, high=20, size=20)
X = np.array([x1, x2]).reshape(-1, 2)
# 如果有a,b两个特征,那么它的2次多项式为(1,a,b,a^2,ab,b^2)
# degree=2:最高升2维,例如a^2;include_bias=False, 常数项不参与预算,即上面的1
# interaction_only:默认为False,如果指定为True,那么就不会有特征自己和自己结合的项,例如a^2
pf = PolynomialFeatures(degree=2, include_bias=False, interaction_only=False)  # 升维
X = pf.fit_transform(X)
# print(X)


X_train, X_test, y_train, y_test = train_test_split(X, y, test_size=0.25, random_state=2)
# 必须先拆分,在标准化,因为测试集是未来的数据,不可能知道未来的数据
std_X = StandardScaler()       # 标准化
X_train = std_X.fit_transform(X_train)
X_test = std_X.transform(X_test)

std_y = StandardScaler()
y_train = std_y.fit_transform(y_train.reshape(-1, 1))
y_test = std_y.transform(y_test.reshape(-1, 1))

lr = LinearRegression()
lr.fit(X_train, y_train)
coef = np.around(lr.coef_[0], decimals=1)        # 求出系数,保留两位小数
inte = np.around(lr.intercept_[0], decimals=3)    # 求出偏置
print(inte)

print(f'{coef[0]}*x1+{coef[1]}*x2+{coef[2]}*x1*x1+{coef[3]}*x1*x2+{coef[4]}*x2*x2+{inte}')   # 训练得出的结果
y_pre = lr.predict(X_test)
score = lr.score(X_test, y_test)

# 误差分析
mae = mean_absolute_error(y_test, y_pre)  # 绝对值误差
mse = mean_squared_error(y_test, y_pre)   # 均方误差
r2_s = r2_score(y_test, y_pre)            # 拟合度
r2_l = lr.score(X_test, y_test)            # 拟合度的另一种求法
print(f'mae:{mae};mse:{mse};r2_s:{r2_s};r2_l:{r2_l}')

 浙公网安备 33010602011771号