Python的 plot函数和绘图参数设置
python的plot函数参数很多,其中主要有:
plot([x], y, [fmt], data=None, **kwargs)
plot([x], y, [fmt], [x2], y2, [fmt2], ..., **kwargs)

 Parameters
        ----------
        x, y : array-like or scalar
            The horizontal / vertical coordinates of the data points.
            *x* values are optional. If not given, they default to
            ``[0, ..., N-1]``.

            Commonly, these parameters are arrays of length N. However,
            scalars are supported as well (equivalent to an array with
            constant value).

            The parameters can also be 2-dimensional. Then, the columns
            represent separate data sets.

        fmt : str, optional
            A format string, e.g. 'ro' for red circles. See the *Notes*
            section for a full description of the format strings.

            Format strings are just an abbreviation for quickly setting
            basic line properties. All of these and more can also be
            controlled by keyword arguments.
而在使用的时候,参数格式有:
1. fmt 参数:
 **Format Strings**
        A format string consists of a part for color, marker and line::
            fmt = '[color][marker][line]'
2. color 参数:
        **Colors**
        The following color abbreviations are supported:
        =============    ===============================
        character        color
        =============    ===============================
        ``'b'``          blue
        ``'g'``          green
        ``'r'``          red
        ``'c'``          cyan
        ``'m'``          magenta
        ``'y'``          yellow
        ``'k'``          black
        ``'w'``          white
        =============    ===============================

        If the color is the only part of the format string, you can
        additionally use any  `matplotlib.colors` spec, e.g. full names
        (``'green'``) or hex strings (``'#008000'``).
3. marker 参数:
        **Markers**
        =============    ===============================
        character        description
        =============    ===============================
        ``'.'``          point marker
        ``','``          pixel marker
        ``'o'``          circle marker
        ``'v'``          triangle_down marker
        ``'^'``          triangle_up marker
        ``'<'``          triangle_left marker
        ``'>'``          triangle_right marker
        ``'1'``          tri_down marker
        ``'2'``          tri_up marker
        ``'3'``          tri_left marker
        ``'4'``          tri_right marker
        ``'s'``          square marker
        ``'p'``          pentagon marker
        ``'*'``          star marker
        ``'h'``          hexagon1 marker
        ``'H'``          hexagon2 marker
        ``'+'``          plus marker
        ``'x'``          x marker
        ``'D'``          diamond marker
        ``'d'``          thin_diamond marker
        ``'|'``          vline marker
        ``'_'``          hline marker
        =============    ===============================
4. linestyle 参数:
        **Line Styles**
        =============    ===============================
        character        description
        =============    ===============================
        ``'-'``          solid line style
        ``'--'``         dashed line style
        ``'-.'``         dash-dot line style
        ``':'``          dotted line style
        =============    ===============================
5. 而绘图参数非常多,部分详细介绍可见:https://www.cnblogs.com/qi-yuan-008/p/12588121.html
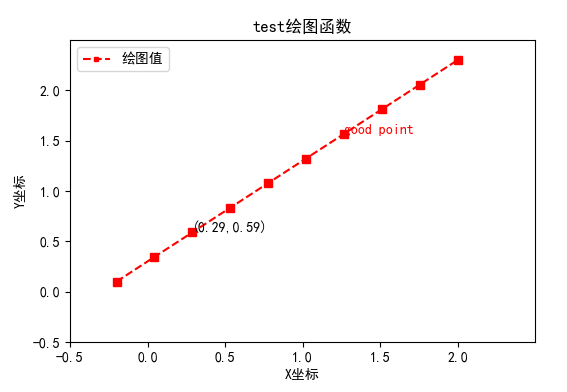
6. 以下用一个例子来说明,可能更快一些:
import matplotlib.pyplot as plt
import numpy as np

fig = plt.figure(1)

x2 = np.linspace(-0.2, 2, 10)
y2 = x2 + 0.3
plt.plot(x2, y2, color="red", linewidth=1.0, marker = 's', linestyle="--")
# plt.plot(x2, y2, color="#ef5492", linewidth=2.0, marker = 's', linestyle="--")  #也可
# plt.plot(x2, y2, 'rs--')                                                        #也可

#设置X轴标签
plt.xlabel('X坐标')
#设置Y轴标签
plt.ylabel('Y坐标')

plt.title('test绘图函数')

#设置图标
#plt.legend('绘图值', loc=2, fontsize = 5)
#  The relative size of legend markers compared with the originally drawn ones.
plt.legend(['绘图值'], loc='upper left', markerscale = 0.5, fontsize = 10)

# 设置横轴的上下限
plt.xlim(-0.5, 2.5)
# 设置纵轴的上下限
plt.ylim(-0.5, 2.5)

# 设置横轴精准刻度
plt.xticks(np.arange(-0.5, 2.5, step=0.5))
# 设置纵轴精准刻度
plt.yticks(np.arange(-0.5, 2.5, step=0.5))

#plt.annotate("(" + str(round(x[2],2)) +", "+ str(round(y[2],2)) +")", xy=(x[2], y[2]), fontsize=10, xycoords='data')
plt.annotate("({0},{1})".format(round(x2[2],2), round(y2[2],2)), xy=(x2[2], y2[2]), fontsize=10, xycoords='data')
# xycoords='data' 以data值为基准
# 设置字体大小为 10

plt.text(round(x2[6],2), round(y2[6],2), "good point", fontdict={'size': 10, 'color': 'red'})  # fontdict设置文本字体
# Add text to the axes.

plt.rcParams['font.sans-serif']=['SimHei'] #用来正常显示中文标签
plt.rcParams['axes.unicode_minus']=False #用来正常显示负号

plt.savefig('test_xx.png', dpi=100, transparent=False)
# dpi: The resolution in dots per inch
#  If *True*, the axes patches will all be transparent

plt.show()
##
参考:
https://blog.csdn.net/u014636245/article/details/82799573
https://matplotlib.org/api/_as_gen/matplotlib.pyplot.figure.html#matplotlib.pyplot.figure
https://www.jianshu.com/p/78ba36dddad8
https://blog.csdn.net/u010852680/article/details/77770097
https://blog.csdn.net/u013634684/article/details/49646311

