python可视化大屏-疫情监控图(4)词云、标题、大屏
最终结果(本页面只是一部分的代码,数据的爬取和其他图片的呈现请点击主页查看)


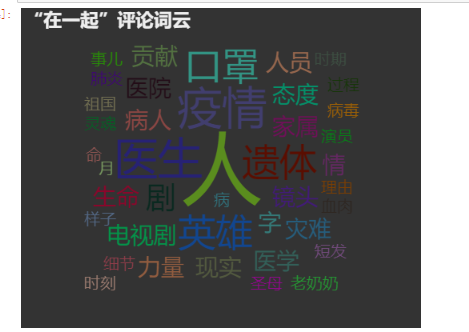
词云
数据准备 https://files.cnblogs.com/files/blogs/673788/data.zip?t=1636387982&download=true

导入的库
from pyecharts import options as opts
from pyecharts.charts import Geo
from pyecharts.globals import ChartType, SymbolType
from pyecharts.charts import Map
import pandas as pd
from pyecharts.charts import Bar
from pyecharts.globals import ThemeType

from pyecharts.charts import Map,Page
代码
import pandas as pd
import jieba
from snownlp import SnowNLP
import pyecharts.options as opts
from pyecharts.charts import WordCloud
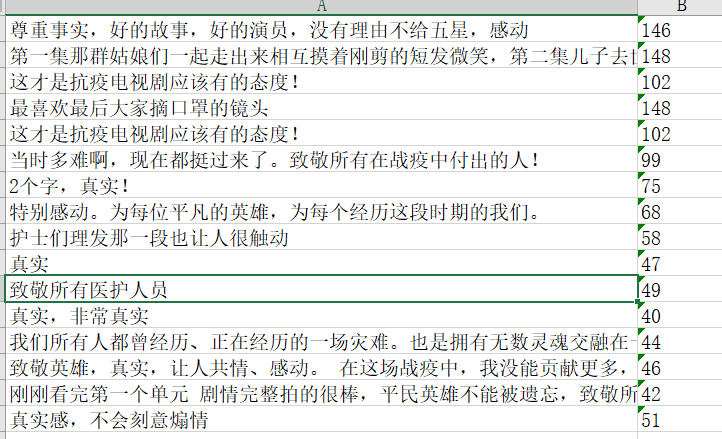
data = pd.read_excel(r'在一起 短评1.xlsx')
data['词性标注'] = data['评论'].agg(lambda x:list(SnowNLP(x).tags))
# 把词性一列中所有列表的数据对拼接到一个列表中,方便后续分析
list_tags = []
for i in data['词性标注']:
    for j in i:
        list_tags.append(j)
list_tags
data_tags = pd.DataFrame(list_tags,columns=['词语','词性'])
result = data_tags[data_tags['词性']=='n'].groupby(by='词语')['词语'].count().sort_values(ascending=False)#[:20]
data_wordcloud_tags = [(i,str(j)) for i,j in zip(result.index,result.values)]
from pyecharts.globals import SymbolType
c3 = (
    WordCloud(init_opts=opts.InitOpts(width='500px',height='400px',theme=ThemeType.DARK))
    .add(series_name="",
         data_pair=data_wordcloud_tags,
         word_size_range=[20, 100],
         shape=SymbolType.DIAMOND,
         textstyle_opts=opts.TextStyleOpts,
        )
    .set_global_opts(
        title_opts=opts.TitleOpts(
            title="“在一起”评论词云", title_textstyle_opts=opts.TextStyleOpts(font_size=23)
        ),
        tooltip_opts=opts.TooltipOpts(is_show=True),
    )
)
c3.render_notebook()
运行结果

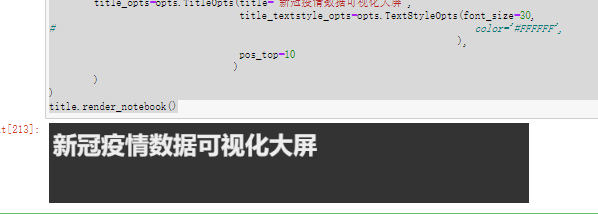
标题设置
from pyecharts.charts import Pie
title = (
    Pie(init_opts=opts.InitOpts(width="600px", height="100px",theme=ThemeType.DARK))# 不画图,只显示一个标题,用来构成大屏的标题
#        theme=ThemeType.CHALK
    .set_global_opts(
        title_opts=opts.TitleOpts(title="新冠疫情数据可视化大屏",
                                  title_textstyle_opts=opts.TextStyleOpts(font_size=30,
#                                                                           color='#FFFFFF',
                                                                         ),
                                  pos_top=10
                                 )
        )
)
title.render_notebook()
运行结果

点击本作者的头像,进入到主页,整合本博客发布的(python可视化大屏-疫情监控图(1),python可视化大屏-疫情监控图(2),python可视化大屏-疫情监控图(3),
python可视化大屏-疫情监控图(4))的代码图片,整合成一个html文件。
from pyecharts.charts import Page

page = Page()
page.add(
    title,
    bar2,
    c,
    map,
    pie,
    c2,
    bar,
    c3,


)
# page.render_notebook()
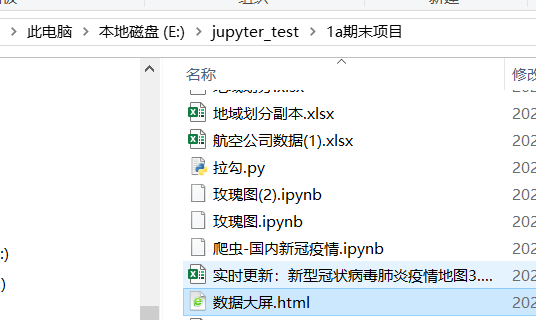
page.render('数据大屏.html')
运行结果

根据结果路径查找点击打开相应的HTML文件

根据css定位标签,选中图像的父节点标签,修改图片的大小和位置
排布图片的位置
from bs4 import BeautifulSoup
with open("数据大屏.html", "r+", encoding='utf-8') as html:
    html_bf = BeautifulSoup(html, 'lxml')
#     html_bf.boy["style"]="background-color: #293441;"
    divs = html_bf.select('.chart-container') # 根据css定位标签,选中图像的父节点标签
    divs[0]["style"] = "width:700px;height:100px;position:absolute;top:10px;left:100px;border-style:dashed;border-color:#444444;border-width:0px;"
    divs[1]["style"] = "width:450px;height:500px;position:absolute;top:100px;left:30px;border-style:dashed;border-color:#444444;border-width:2px;"

    divs[2]["style"] = "width:600px;height:350px;position:absolute;top:100px;left:490px;border-style:dashed;border-color:#444444;border-width:2px;"
    divs[3]["style"] = "width:600px;height:350px;position:absolute;top:450px;left:490px;border-style:dashed;border-color:#444444;border-width:2px;"

    divs[4]["style"] = "width:450px;height:350px;position:absolute;top:100px;left:1100px;border-style:dashed;border-color:#444444;border-width:2px;"
    divs[5]["style"] = "width:450px;height:470px;position:absolute;top:580px;left:30px;border-style:dashed;border-color:#444444;border-width:2px;"
    divs[6]["style"] = "width:450px;height:350px;position:absolute;top:450px;left:1100px;border-style:dashed;border-color:#444444;border-width:2px;"
    divs[7]["style"] = "width:1055px;height:230px;position:absolute;top:810px;left:490px;border-style:dashed;border-color:#444444;border-width:2px;"

    body = html_bf.find("body") # 根据标签名称定位到body标签
    body["style"] = "background-color:#333333;" # 修改背景颜色
    html_new = str(html_bf) # 将BeautifulSoup对象转换为字符
    html.seek(0, 0) # 光标移动至
    html.truncate() # 删除光标后的所有字符内容
    html.write(html_new) # 将由BeautifulSoup对象转换得到的字符重新写入html文件
    html.close()
再次刷新HTML文件就会显示出最终结果


