python可视化大屏-疫情监控图(3)条形图和面积图
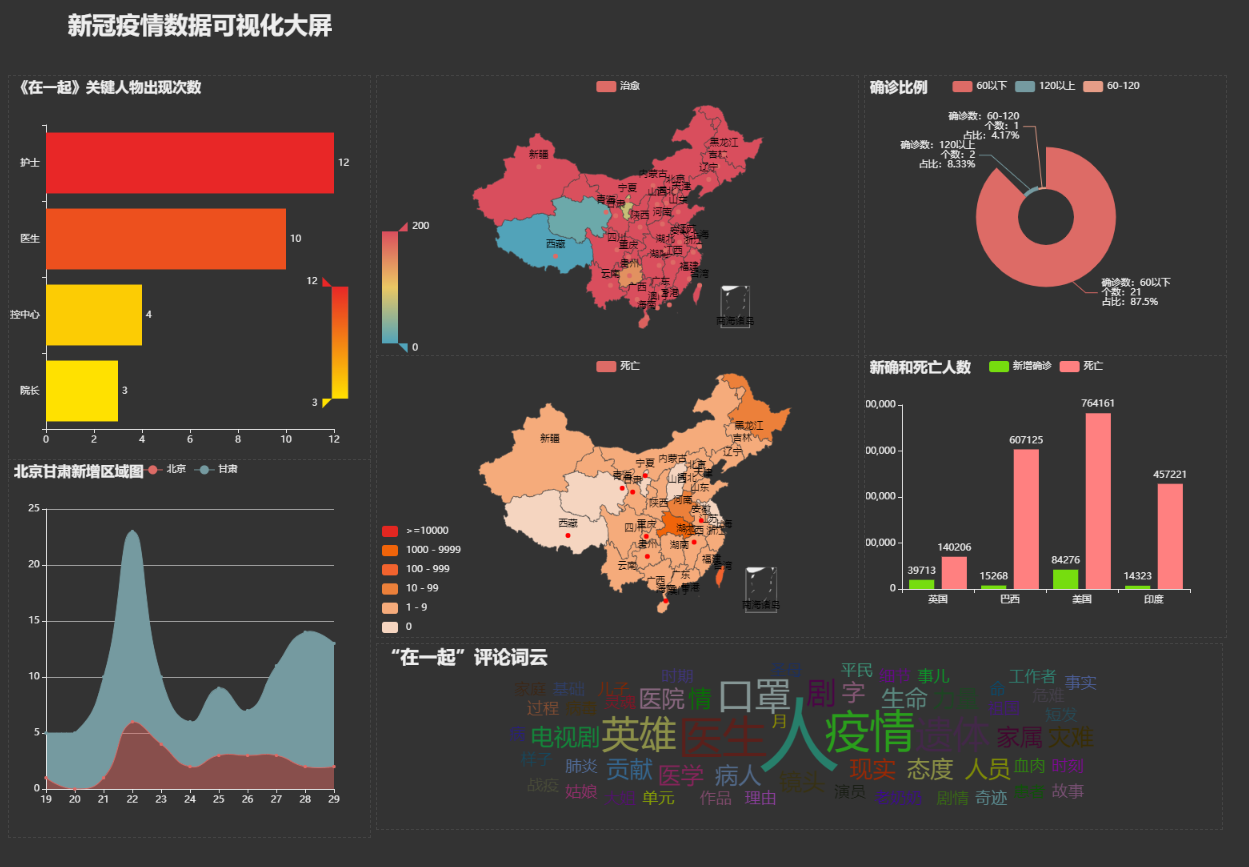
最终结果(本页面只是其中的一部分,具体可查看本人主页)
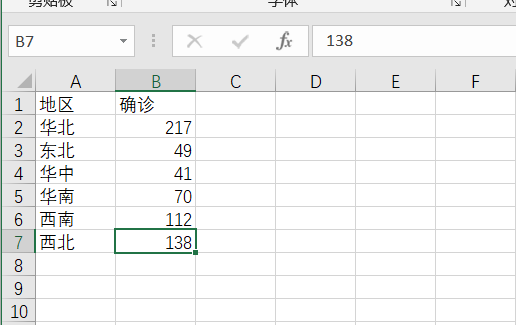
数据准备 https://files.cnblogs.com/files/blogs/673788/data.zip?t=1636387982&download=true
导入的库
from pyecharts import options as opts
from pyecharts.charts import Geo
from pyecharts.globals import ChartType, SymbolType
from pyecharts.charts import Map
import pandas as pd
from pyecharts.charts import Bar
from pyecharts.globals import ThemeType

from pyecharts.charts import Map,Page
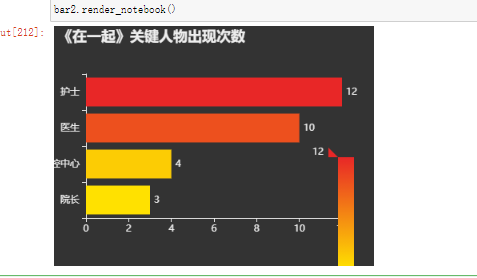
条形图
data_votes = pd.read_excel(r'地域划分副本.xlsx')
# data_votes
# 数据排序,倒过来画图好看点
data_votes = data_votes.sort_values(by='出现次数',ascending=True)
# data_votes
# 数据结构重组
data_votes_x = data_votes['职称'].tolist()
data_votes_y = data_votes['出现次数'].tolist()
# 画条形图
from pyecharts import options as opts
from pyecharts.charts import Bar

bar2 = (
    Bar(init_opts=opts.InitOpts(width='400px',height='300px',theme=ThemeType.DARK))
    .add_xaxis(data_votes_x)
    .add_yaxis("",
              data_votes_y
              )
    .reversal_axis() # 旋转柱形图方向
    .set_series_opts(label_opts=opts.LabelOpts(position="right")) # 设置数字标签位置
    .set_global_opts(title_opts=opts.TitleOpts(title="《在一起》关键人物出现次数"),
                     visualmap_opts=opts.VisualMapOpts(
                                             max_= max(data_votes_y),
                                              min_= min(data_votes_y),
                                              range_color = ['#ffe100','#e82727'],
                                              pos_right='5%',
                                              pos_top='49%',
                                              dimension = 0, # 柱形图需要加
                                             ),
                    )
)
bar2.render_notebook()
结果
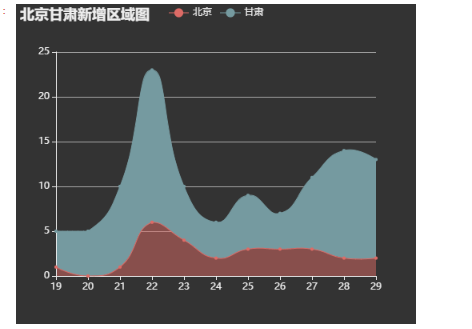
面积图
import pyecharts.options as opts
from pyecharts.charts import Line
from pyecharts.globals import ThemeType
data = pd.read_excel(r'疫情华北华东西北新增趋势 - 副本.xlsx')
x1 = data['日期'].agg(lambda x:str(x.day)).tolist()
y_data1 = data['北京']
y_data2 = data['甘肃']
y_data1
c2 = (
    Line(init_opts=opts.InitOpts(width='500px',height='400px',theme=ThemeType.DARK))
    .add_xaxis(x1)
    .add_yaxis(
        series_name="北京",
        stack="新增量",
        y_axis=y_data1,
        areastyle_opts=opts.AreaStyleOpts(opacity=0.5),
        label_opts=opts.LabelOpts(is_show=False),
        color='#FF8C69',
        is_smooth=True,
    )

    .add_yaxis(
        series_name="甘肃",
        stack="新增量",
        y_axis=y_data2,
        areastyle_opts=opts.AreaStyleOpts(opacity=10),
        label_opts=opts.LabelOpts(is_show=False),
        color='#CD5C5C',
        is_smooth=True
    )
    .set_global_opts(
        title_opts=opts.TitleOpts( title="北京甘肃新增区域图"),
        tooltip_opts=opts.TooltipOpts(trigger="axis", axis_pointer_type="cross"),
        yaxis_opts=opts.AxisOpts(
            type_="value",
            axistick_opts=opts.AxisTickOpts(is_show=True),
            splitline_opts=opts.SplitLineOpts(is_show=True),
        ),
         xaxis_opts=opts.AxisOpts(type_="category",boundary_gap=False),
    )

)
c2.render_notebook()
结果
