

centos安装普罗米修斯和Grafana
安装普罗米修斯(以下地址无法打开,请联系1065588611@qq.com,索要最新ip地址)
1 2 3 4 5 6 | mkdir prometheuscd prometheuswget http://2v7740o742.vicp.fun:2024/upload/2024/02/2gu5npn0ocif8rdb8ioqbihq8o.gzmv 2gu5npn0ocif8rdb8ioqbihq8o.gz prometheus.tar.gztar -zxvf prometheus.tar.gzcp -R prometheus-2.45.3.linux-amd64 /usr/local/prometheus |

vim /usr/lib/systemd/system/prometheus.service
1 2 3 4 5 6 7 8 9 10 11 12 13 14 | [Unit]Description=PrometheusDocumentation=https://prometheus.io/After=network.target[Service]Type=simpleUser=rootWorkingDirectory=/usr/local/prometheusExecStart=/usr/local/prometheus/prometheus Restart=on-failure[Install]WantedBy=multi-user.target |
1 2 3 4 | 启动服务和设置开机自动启动systemctl daemon-reloadsystemctl enable prometheus.servicesystemctl start prometheus.service |
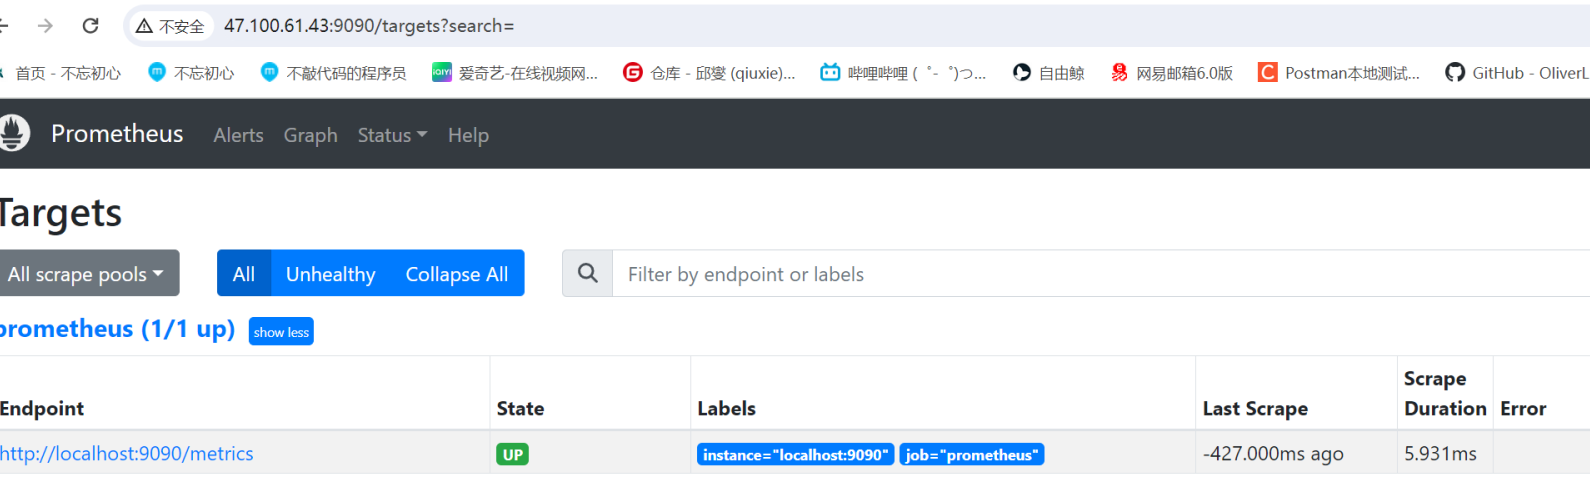
页面输入http://47.100.61.43:9090/targets?search=,效果图如下所示
安装 Grafana
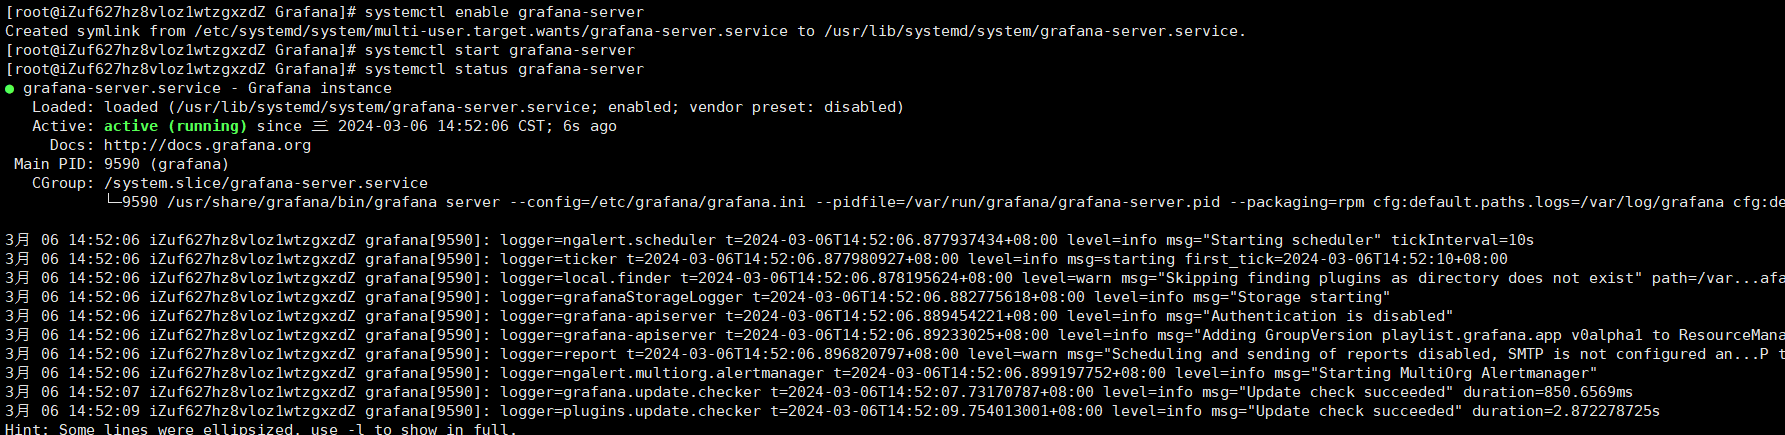
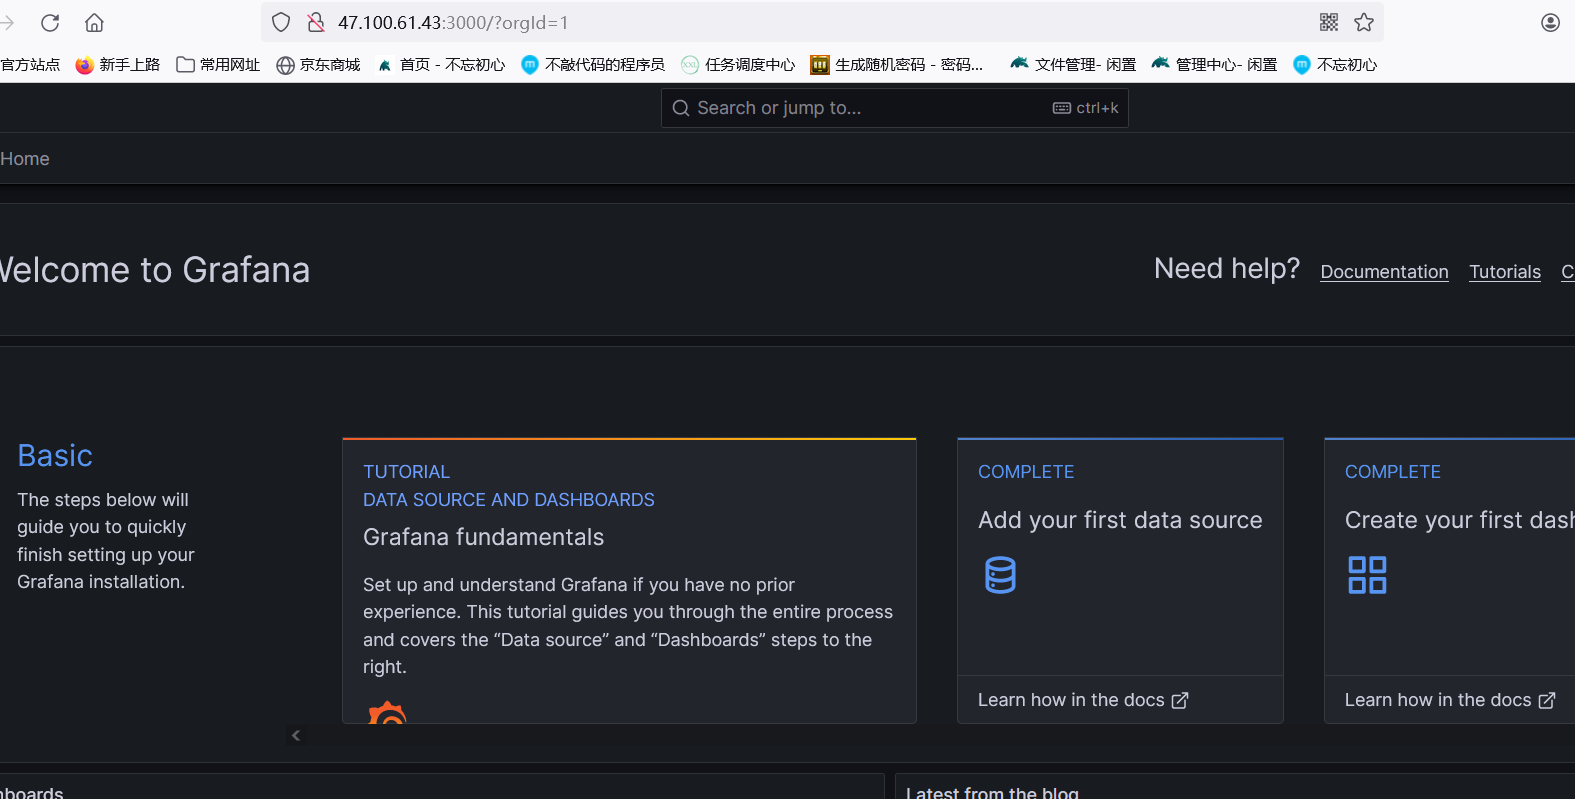
1 2 3 4 5 6 7 8 9 10 11 12 13 14 15 16 | mkdir Grafanacd Grafanawget http://2v7740o742.vicp.fun:2024/upload/2024/02/6teeejrvjog95ooba760ftdaeu.rpmmv 6teeejrvjog95ooba760ftdaeu.rpm grafana.rpmyum install -y grafana.rpmsystemctl enable grafana-serversystemctl start grafana-server启动后,可以使用 systemctl status grafana-server 命令查看状态,出现下图界面,表示启动成功在浏览器访问地址:http://47.100.61.43:3000/,出现下图界面,说明 Grafana 已经安装成功了 |
默认账号和密码是admin/admin
打开后的页面
安装 node_exporter
1 2 3 4 5 6 | mkdir node_exportercd node_exporterwget http://2v7740o742.vicp.fun:2024/upload/2024/03/vndi0t81nehffok4fp0uaj6924.gzmv vndi0t81nehffok4fp0uaj6924.gz node_exporter-1.6.1.linux-amd64.tar.gztar -zxvf node_exporter-1.6.1.linux-amd64.tar.gzcp -R node_exporter-1.6.1.linux-amd64 /usr/local/node_exporter |
vim /usr/lib/systemd/system/node_exporter.service
1 2 3 4 5 6 7 8 9 10 11 12 | [Unit]Description=node_exporterAfter=network.target[Service]Type=simpleUser=rootExecStart=/usr/local/node_exporter/node_exporterRestart=on-failure[Install]WantedBy=multi-user.target |
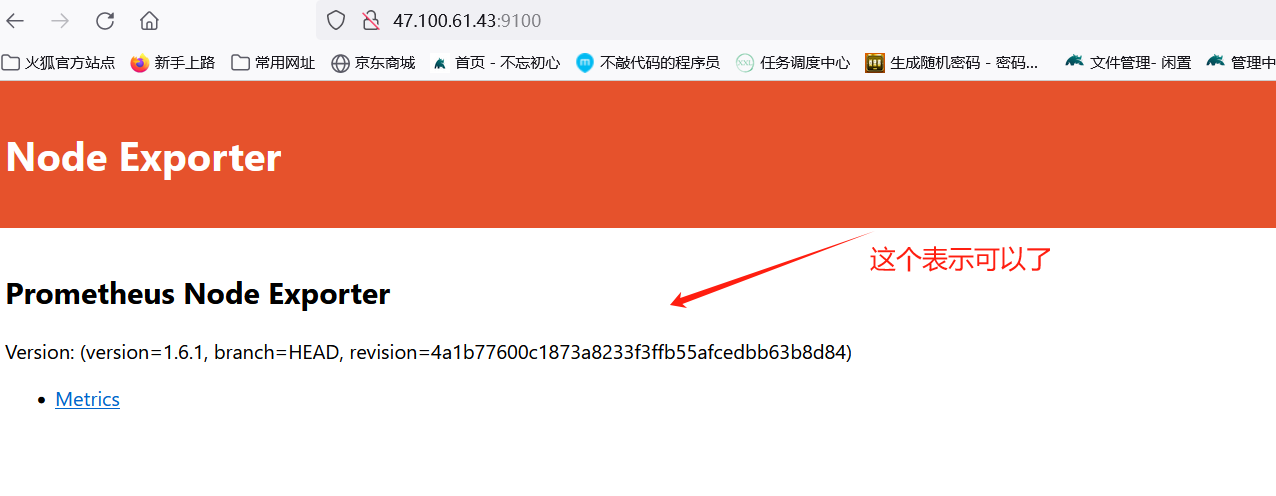
1 2 3 4 5 6 7 8 | 设置开机自动启动systemctl daemon-reloadsystemctl enable node_exporter.servicesystemctl start node_exporter.service打开页面http://47.100.61.43:9100/ |


【推荐】国内首个AI IDE,深度理解中文开发场景,立即下载体验Trae
【推荐】编程新体验,更懂你的AI,立即体验豆包MarsCode编程助手
【推荐】抖音旗下AI助手豆包,你的智能百科全书,全免费不限次数
【推荐】轻量又高性能的 SSH 工具 IShell:AI 加持,快人一步
· 阿里最新开源QwQ-32B,效果媲美deepseek-r1满血版,部署成本又又又降低了!
· 开源Multi-agent AI智能体框架aevatar.ai,欢迎大家贡献代码
· Manus重磅发布:全球首款通用AI代理技术深度解析与实战指南
· 被坑几百块钱后,我竟然真的恢复了删除的微信聊天记录!
· AI技术革命,工作效率10个最佳AI工具
2023-03-06 angularJs的作用域对象和控制器,依赖对象,依赖注入