

安卓性能调优工具简介
Traceview
Traceview是执行日志的图形查看器。这些日志通过使用Debug类记录。 Traceview可以帮助调试应用和profile性能。本文参考英文地址:http://developer.android.com/intl/zh-cn/tools/debugging/debugging-tracing.html。
Traceview布局
Traceview可以加载trac日志文件(通过添加跟踪代码添加到应用或由DDMS生成)。TraceView的界面分为两部分,上面是时间线面板(Time Panel),描述了当每个线程和方法的启动和停止时间。下面是profile面板,概述方法所做的事情,如下图所示:

时间线面板:

profile面板:
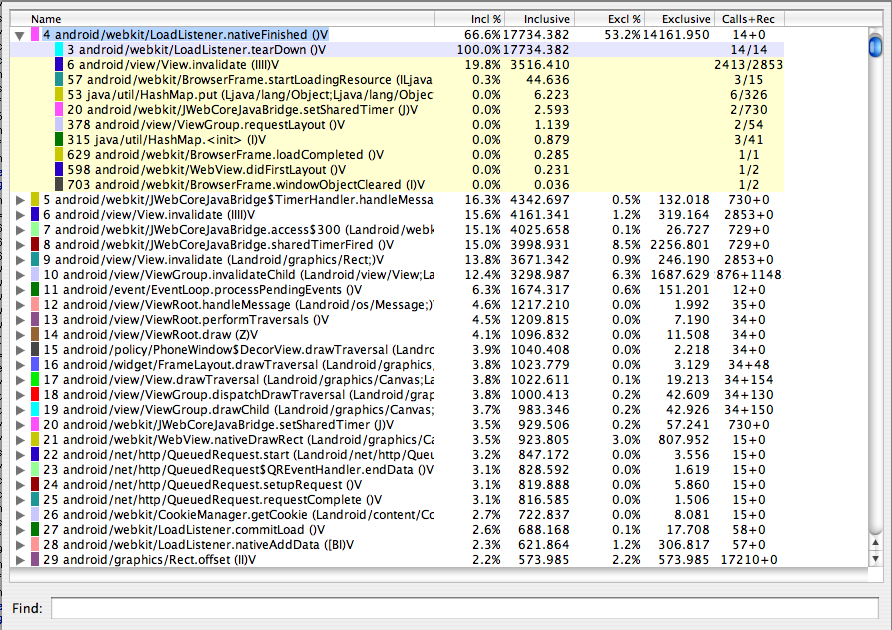
Name :调用项,前面的数字是编号,展开可以看到有的有Parent 和Children子项。
Incl : inclusive时间占总时间的百分比
inclusive : 子方法的调用时间和方法执行时间
Excl : 执行占总时间的百分比。
Exclusive : 方法执行时间,不包含子方法的时间。
Calls+Recur Calls/Total : 调用和重复调用的次数
Time/Call : 总的时间。(ms)
生成跟踪日志
有两种方法可以生成跟踪日志:
在代码中包含Debug类并调用其方法,如startMethodTracing()和stopMethodTracing(),这种方法很精确。
使用DDMS的profile分析功能来生成跟踪日志。不太准确,不能够访问应用程序的代码或不需要精确的记录时间时使用。
注意:如果使用Debug类,应用程序必须具有外部存储的写权限(WRITE_EXTERNAL_STORAGE)。
    // start tracing to "/sdcard/calc.trace"
    Debug.startMethodTracing("calc");
    // ...
    // stop tracing
    Debug.stopMethodTracing();
应用调用startMethodTracing()时,系统会创建<trace-base-name>.trace文件。这包含二进制方法跟踪数据和线程及方法名映射表。
然后系统开始缓冲生成的跟踪数据,直到应用程序调用stopMethodTracing(),此时将其缓冲的数据写入到输出文件中。如果系统调用stopMethodTracing前达到最大缓冲器大小,系统停止trace并发送通知给控制台。
开启profile时,解释的代码运行速度会较慢,并不代表实际执行速度。
在Android的4.4和更高版本,取样会减少性能影响。使用startMethodTracingSampling()即可,停止依旧使用stopMethodTracing()。
执行实例:
C:\Users\Administrator>adb pull /mnt/sdcard/tc.trace /tmp/tc.trace

C:\Users\Administrator>adb shell am start -n com.mamlambo.article.simplecalc/.MainActivity
Starting: Intent { cmp=com.mamlambo.article.simplecalc/.MainActivity }

C:\Users\Administrator>adb shell am profile com.mamlambo.article.simplecalc start /mnt/sdcard/tc.trace

C:\Users\Administrator>adb shell am profile com.mamlambo.article.simplecalc stop


C:\Users\Administrator>adb pull /mnt/sdcard/tc.trace /tmp/tc.trace
1352 KB/s (2429326 bytes in 1.754s)


C:\Users\Administrator>traceview c:\tmp\tc.trace
The standalone version of traceview is deprecated.
Please use Android Device Monitor (tools/monitor) instead.
注意:若出现mkdir failed for img Read-only file system,在执行 adb shell 命令后执行mount -o remount ,rw /即可
另外要配置能读存储卡:
<uses-permission android:name="android.permission.WRITE_EXTERNAL_STORAGE">
</uses-permission>
生成调用关系图:
dmtracedump -g output.png YourAppName.trace
调用关系图实例:

另外,trace文件用Android Studio的Android Device Monitor打开。注意:Traceview现在和JIT不能共存!
dmtracedump能根据trace log生成调用栈图。该工具使用的Graphviz工具来创建图形输出。 每个节点的含义:<ref> callname (<inc-ms>, <exc-ms>,<numcalls>)。
dmtracedump的使用方法:
dmtracedump [-ho] [-s sortable] [-d trace-base-name] [-g outfile] <trace-base-name>
工具加载<trace-base-name>.data和<trace-base-name>.key。
|
参数 |
描述 |
|
-d <trace-base-name> |
URL base to the location of the sortable javascript file |
|
-g <outfile> |
Generate output to <outfile> |
|
-h |
Turn on HTML output |
|
-o |
Dump the trace file instead of profiling |
|
-t <percent> |
Minimum threshold for including child nodes in the graph (child's inclusive time as a percentage of parent inclusive time). If this option is not used, the default threshold is 20%. 最低门槛,包括子节点图中(孩子接点的包容性的时间占母接点包容性的时间)。如果不使用此选项,默认阈值是20%。 |
HTML格式输出:
dmtracedump –h /tmp/dmtrace.trace > dmtrace.html

其他可以参考的资料:http://www.open-open.com/lib/view/open1430892721648.html。

 浙公网安备 33010602011771号